Below are a few charts showing some significant divergences that frequently precede market reversals:


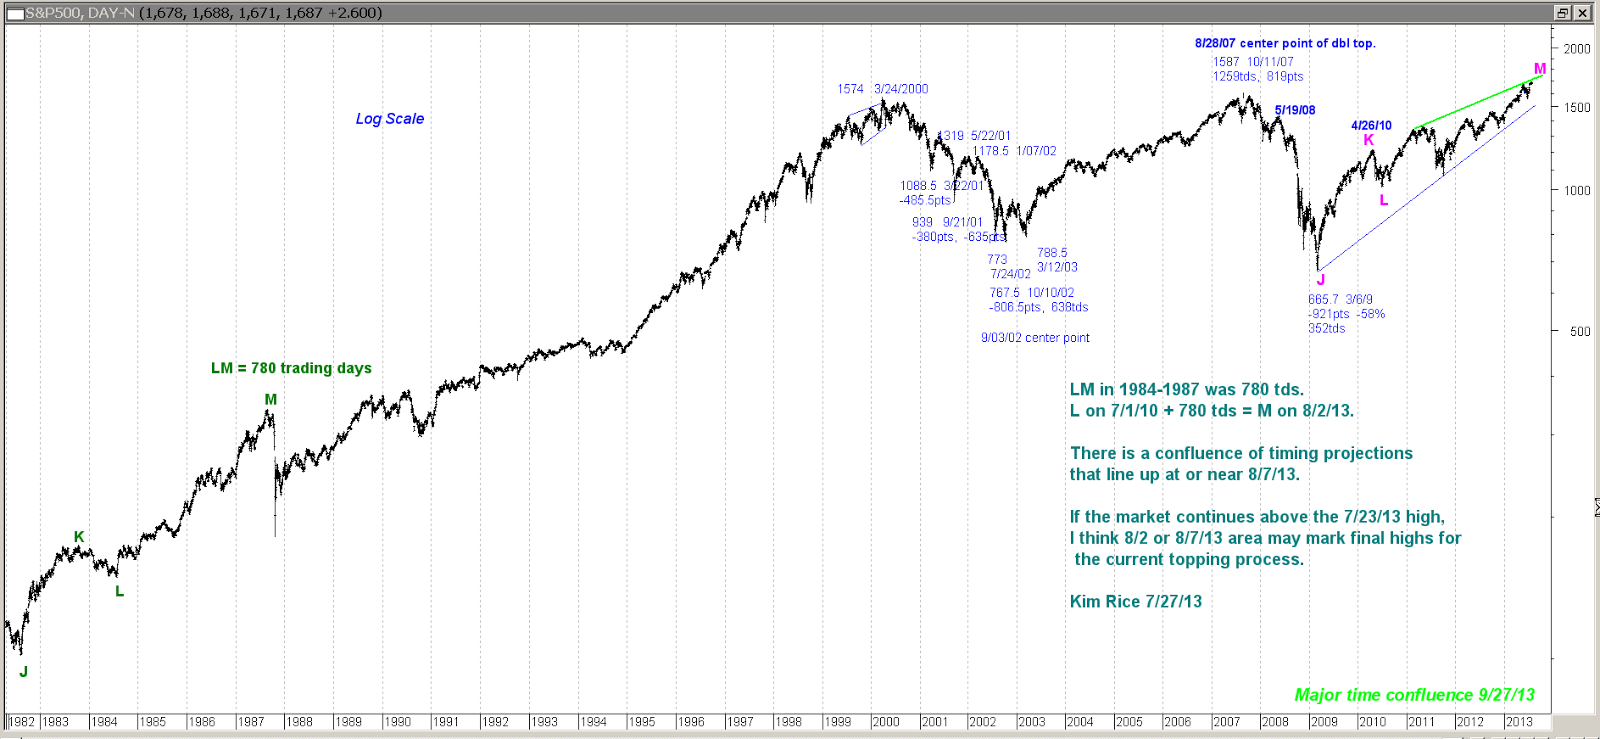
Here's a chart showing a possible timing analog between the 780 trading day rally that peaked in 1987 and the current rally from 7/01/10 that will equal 780 trading days on 8/2/13.
The next chart shows a possible 1.272 projection confluence around 15,760 on the DJI, which would have symmetry with the 2002 to 2007 1.272 expansion.

Lastly, the next chart shows a major confluence of daily, weekly and monthly timing projections that point to the week of 8/9/13, with all daily projections pointing to 8/7/13. I think 8/7/13 area could either mark the final top, a lower high before a meltdown, or a crash low.
Kim Rice

No comments:
Post a Comment