Sunday, January 11, 2015

NYA Fractal and Dollar Price and Time Analysis

Below are 3 charts depicting a potential fractal/analog pattern unfolding in the NYA index. The fist chart is a longer term view to give context. The other 2 charts are zoomed in views to show the almost perfect symmetry between the 2007 top and the presumed 2014/2015 top. One never knows how long these types of analogs will track, but it's certainly one I'm watching and have it as my highest probability scenario until proven otherwise. Time-wise, it may need more time to play out before breaking down but it could break down at any time (if it is a big top that's formed over the last 6 months). If the NYA instead breaks out to new all-time highs, obviously the analog would not be tracking and some other pattern is underway.


Below is a long-term chart of the dollar with some price and time analysis I did a few weeks ago but never got around to posting. The bottom line on the dollar is I expect at least an intermediate top sometime in Jan 2015 followed by a multi-week or multi-month correction. After that anticipated correction the jury is still out, but I'm leaning toward a continuation of the bull move (ideally into early 2017).


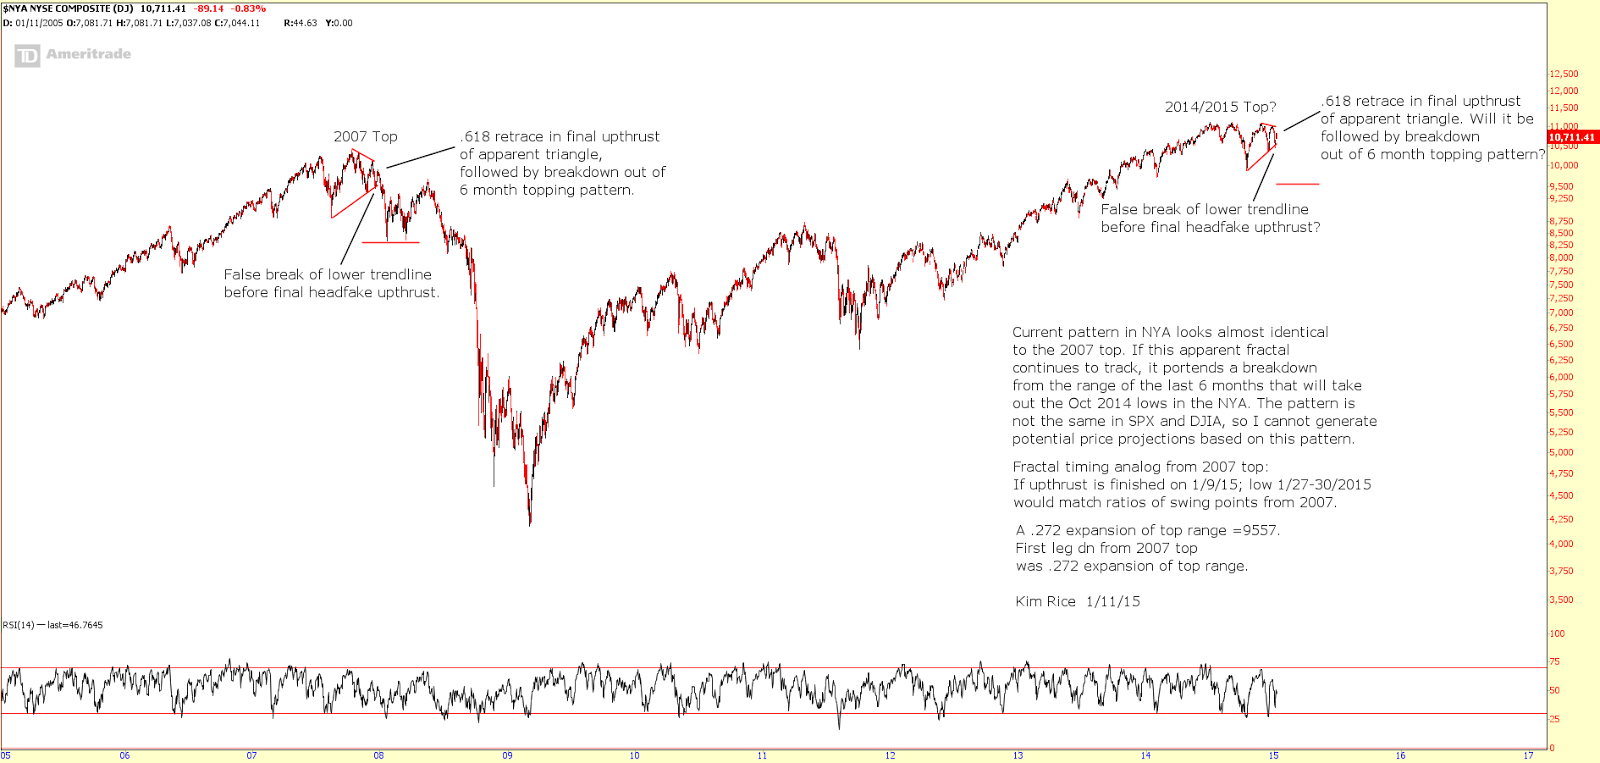
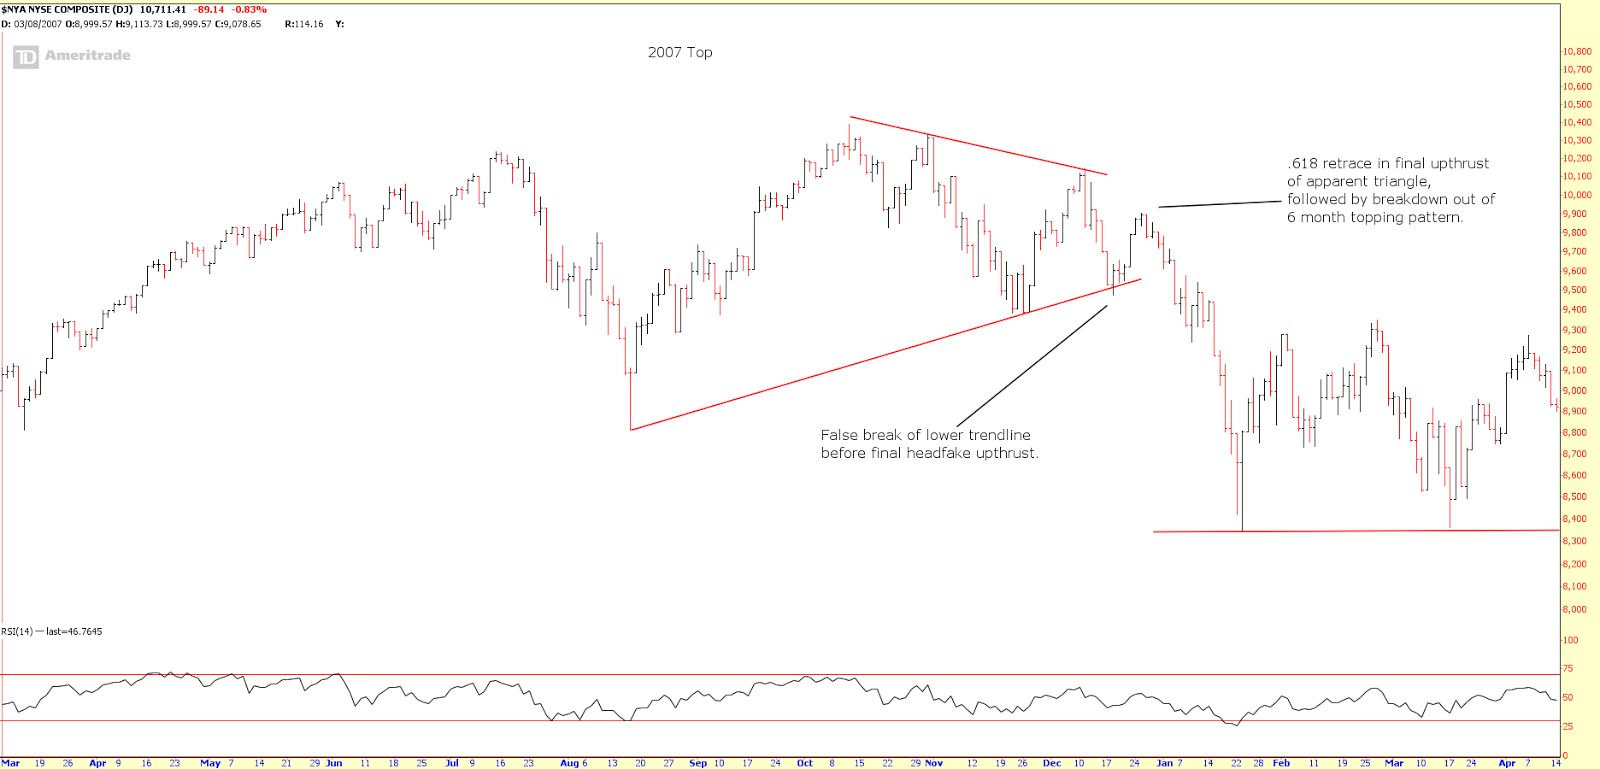
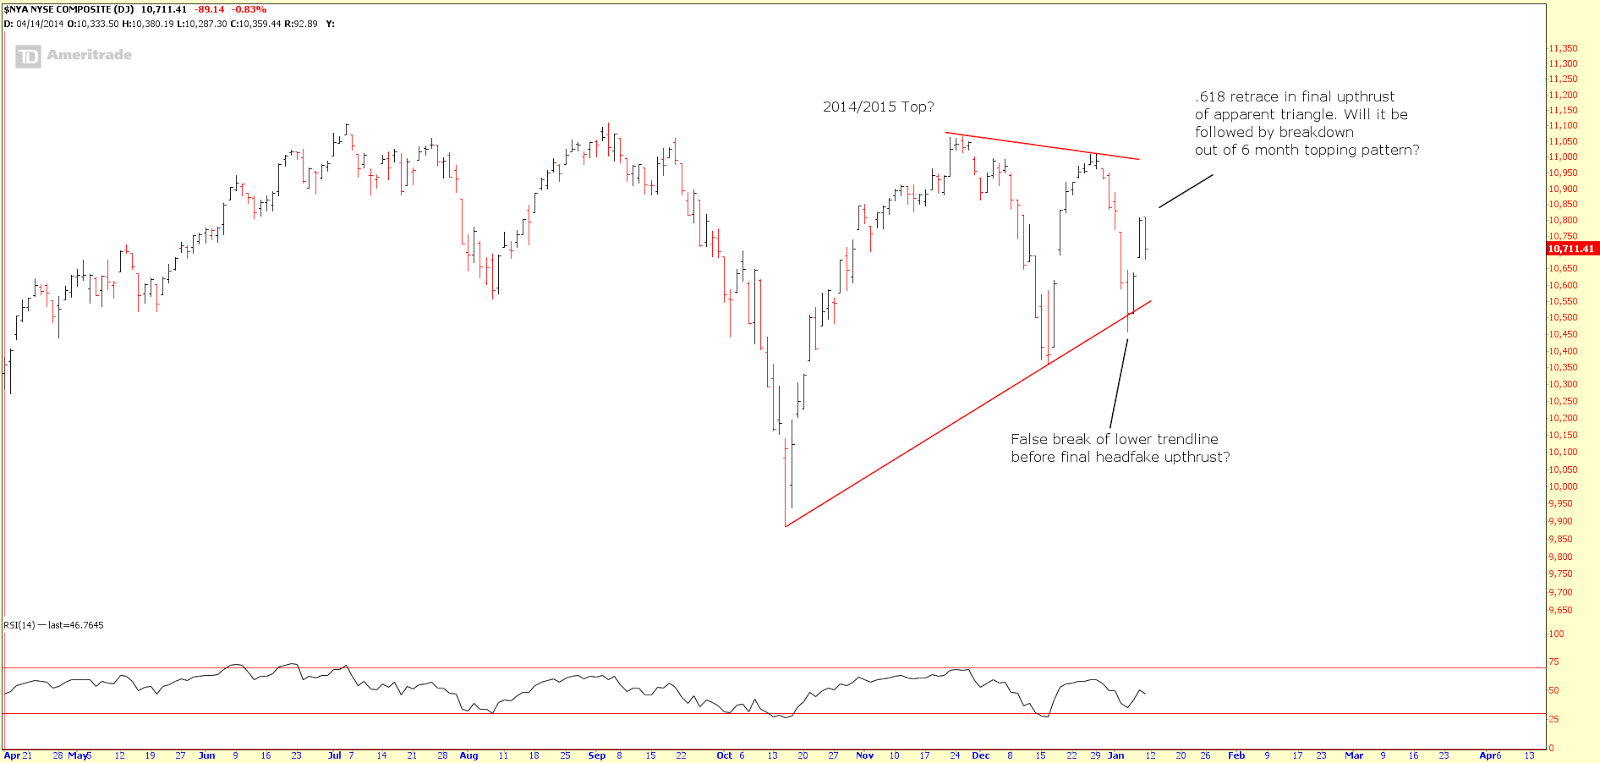
The remaining charts below show some timing analysis I did a few weeks ago on the long-term DJIA chart. Based on the significant confluence of important time squares that line up in the late Dec 2014 to early Feb 2015 window, I think an important reversal is likely to occur. The next big CIT timing I see is in early March, but I'll have to post on that one later.
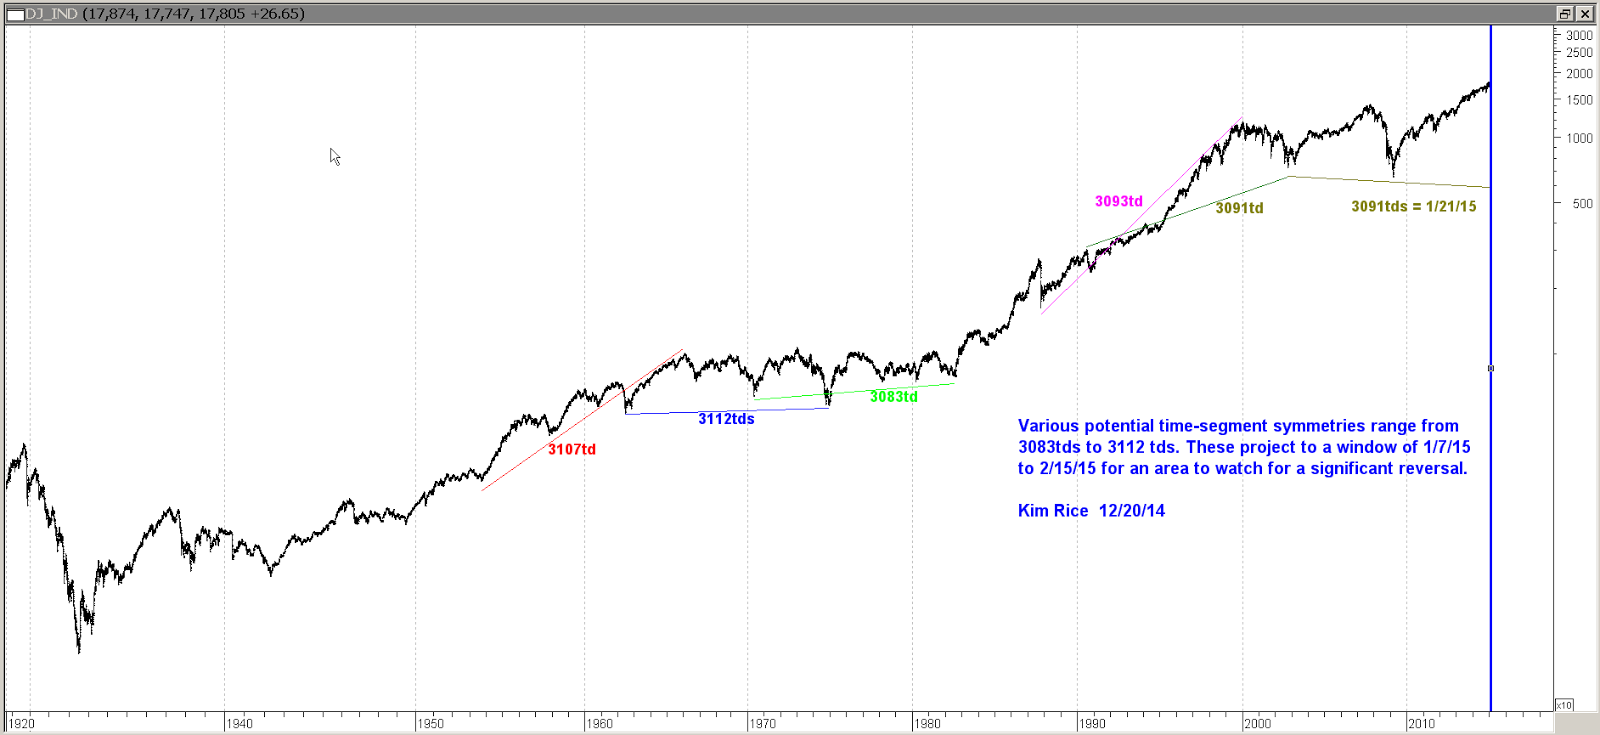


Kim Rice 1/11/15