I think the top is probably in on the DJIA, though a significant move above the 12/31/13 highs would flush that idea. The high on 12/31/13 was exactly at an expression of pi in time: 31.4159 years from the 8/9/82 low, as noted on
this chart posted 12/29/13. That translates to 11,467 cal days calculated as 31.4159 x 365. If you add 11,467 cal days (or 31.4159 years) to 8/9/82 it equals 12/31/13. Also, the DJIA appears to have 5 waves down from the top, whereas most other indicies are difficult to count as 5s down. So, it's very possible that some indicies run to new highs into Feb/Mar timeframe while the DJIA does not (or perhaps the DJIA double tops).
The price projections to the 4400 area for the valueline index shown on the charts in the
previous post were pretty much hit exactly at the highs a few weeks back. Still can't rule out a run to the 4438 area (or higher) if the topping process isn't done. Here's an update of the VLE chart showing an intraday high so far of 4414.

Here are updates to several charts posted recently. The DJIA stopped right at the upper trend line. The Russell 2000 had a bit of a throw-over on wave 5, about the same as the throw-under at wave 4.
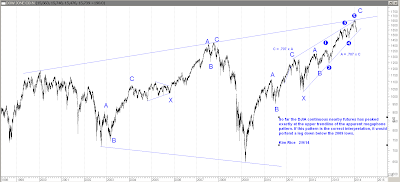

The following chart is annotated with analysis showing potential timing of turns in Feb and Mar 2014. Cycles and time squares work for a while and then just stop without notice. I have no idea if the cycles and timing projections noted on this next chart will work or not, but they do present areas to look for trades/reversals.

Lastly, here is a chart showing the top of the Tulip Bulb Mania back in the 1600s. As I've noted in the past, Feb 2014 marks the 377 (fibonacci) year anniversary of that top which was followed by a total collapse. I suppose our current stock market could rhyme with that period, given the fact that the whole market is one giant bubble largely supported by central banks around the world. However, even if we are making a major top, I suspect the move down wouldn't be anywhere near as dramatic.

Kim Rice 2/9/14


