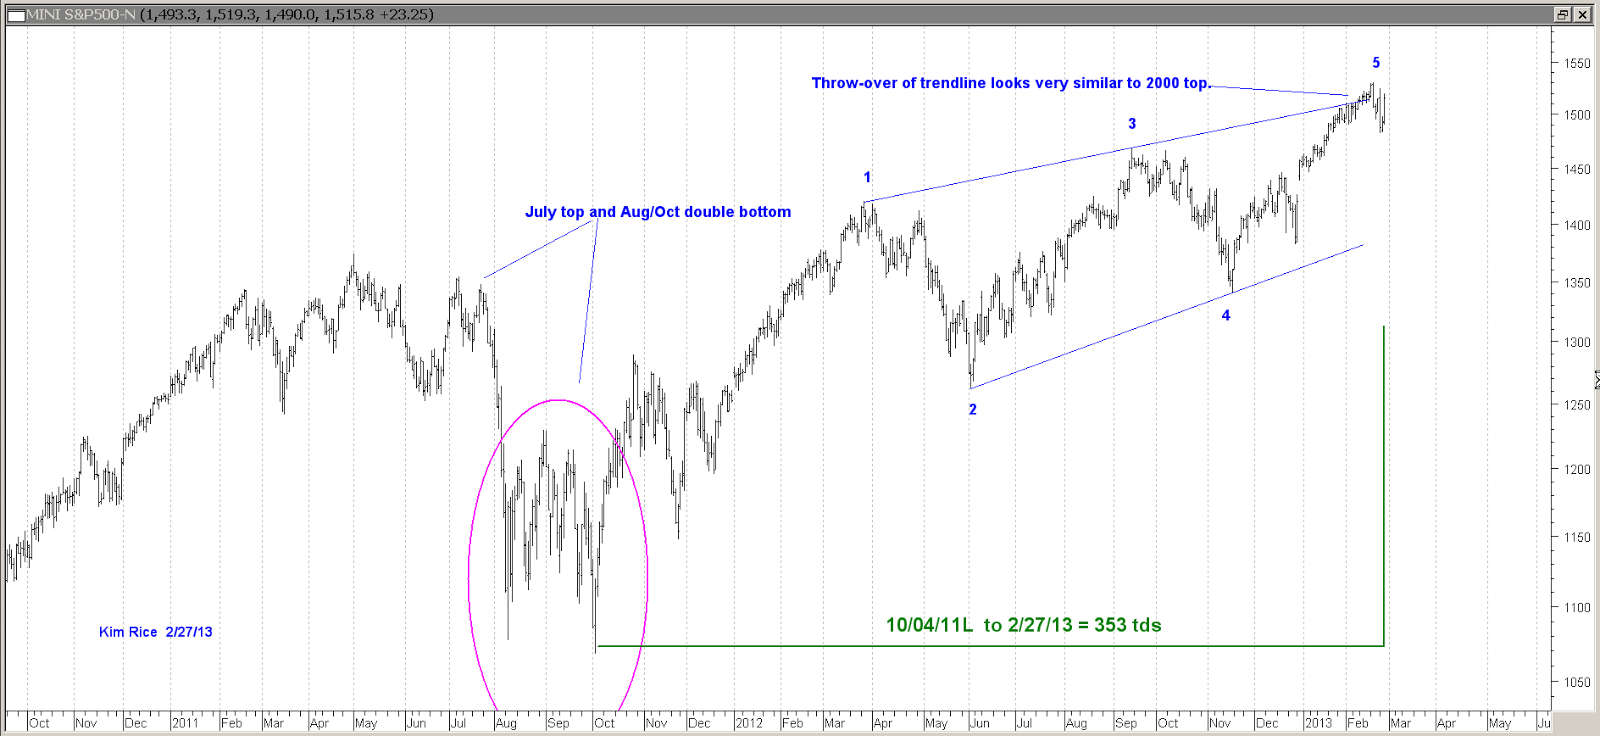
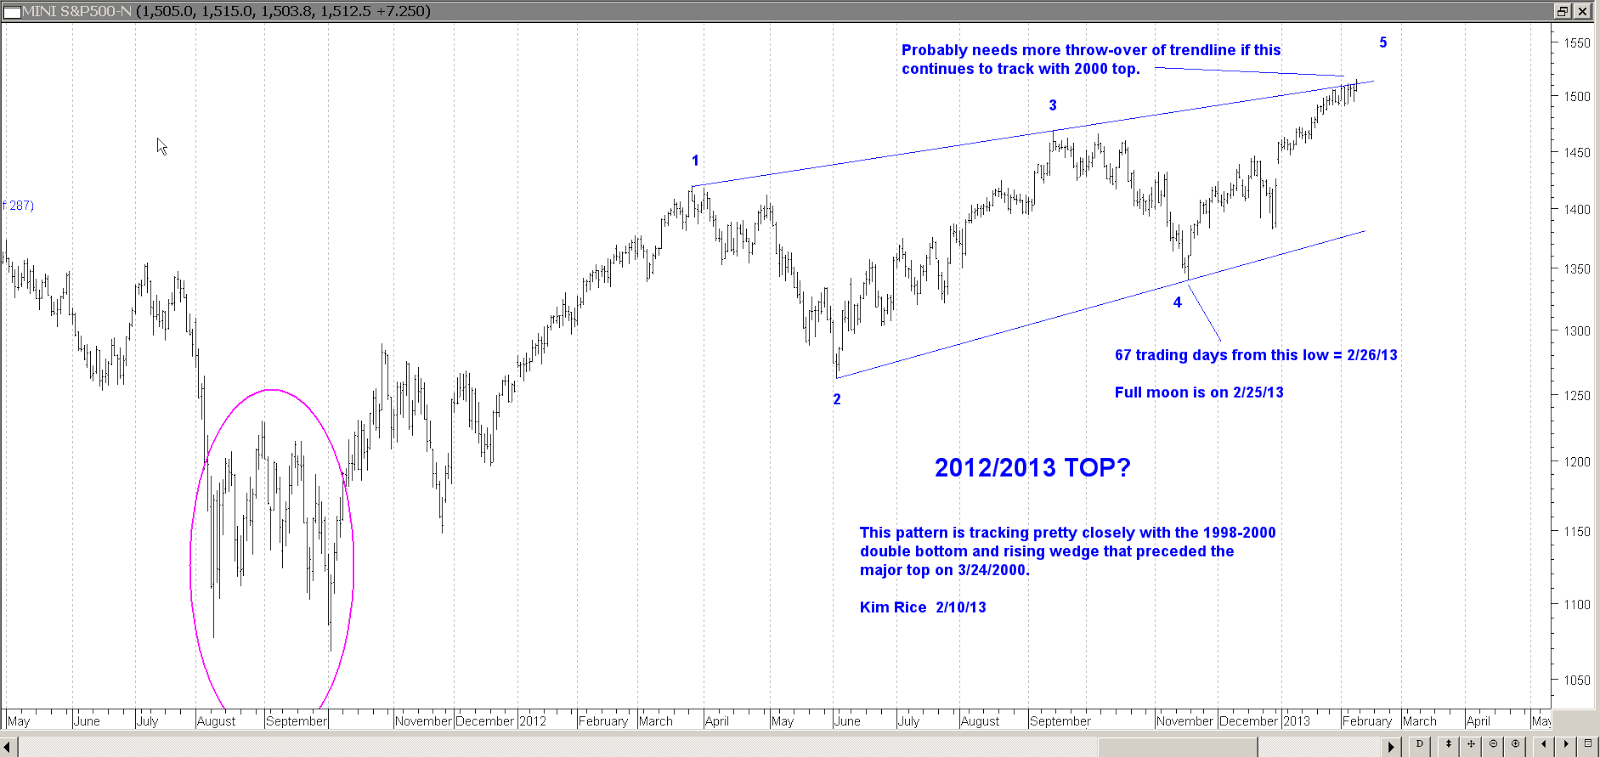
Posted below are updates to a few charts and another chart showing a pi and phi alignment on 2/27/13.
I began accumulating Sep and Jan SDS calls (double short ETF) on the close today, 2/27. If I'm wrong and the market continues higher for a while, I suspect we will have significant correction (just based on current sentiment readings alone) long before the calls decay too much. I will look to get more aggressively short on a break of the 2/26 low. If/when the 2/26/13 low is broken, stops would be placed 1 point above whatever high is achieved on the rally since the 11/16/12 low .
There are any number of possibilities that may unfold after this confluence window:
a) the market ignores this timing confluence and keeps on going up,
b) the market turns down and does one of its little pullbacks that brings out all the buy-the-dippers that have had their way for a long time now, and the market then takes another leg up into May where there is another timing confluence that may mark the end of the bull since 2009 low,
c) the market turns down for a reasonably innocuous looking correction followed by a 50-70% retracement which then rolls over into a wave of highly motivated selling that climaxes around 4/24/13 (ref 1929 and 1987).
d) the market turns down with a scary sell-off, but rallies back to near the highs and starts a slow grind down before more significant declines happen later in the year (ref 2000 and 2007).
I'm leaning toward c or d as being most probable, but I'm fully aware that virtually anything is possible. I think it's very possible the music stops on or near 2/27/13. I recommend finding a chair pretty soon if it does.