Based on some timing and pattern analysis I'm looking at in stocks, the sideways chop since the 6/24/14 outside day reversal should end 6/30 or 7/1 area and begin trending down thereafter. The next timing confluence I see is 7/15/14 +/- a trading day or two. My best guess regarding polarity is that it will likely be a low in that time-frame, but won't know until we get there.
Kim Rice 6/30/14
Monday, June 30, 2014
Thursday, June 26, 2014
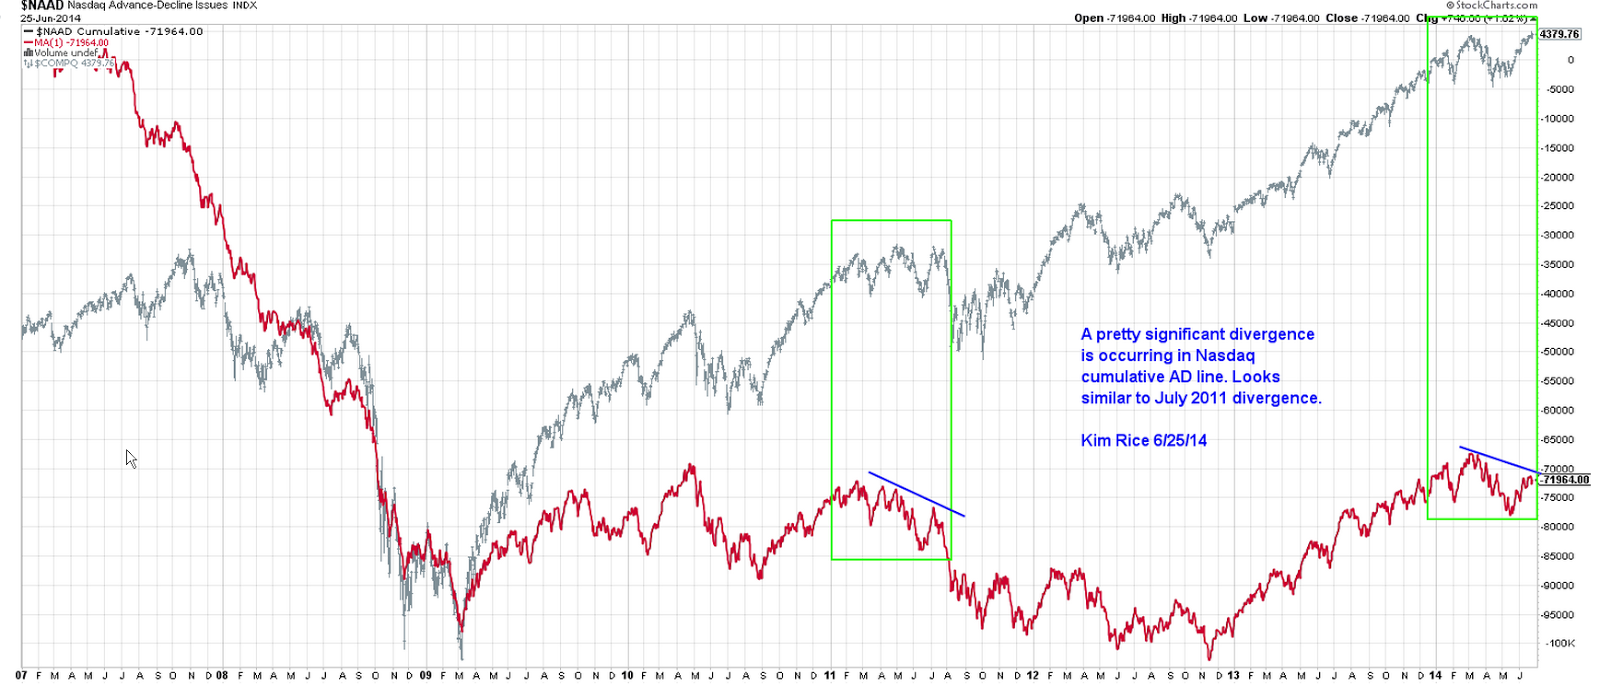
Internals Weakening for Stocks & SPX Projection
For those that remain bullish on stocks, what is bullish about the following chart?

Here's a chart showing an interesting fibonacci projection I've been looking at for a potential top in stocks. We got within about 1 point of the exact target on 6/23/14.

Kim Rice 6/26/14
Here's a chart showing an interesting fibonacci projection I've been looking at for a potential top in stocks. We got within about 1 point of the exact target on 6/23/14.

Kim Rice 6/26/14
Sunday, June 22, 2014
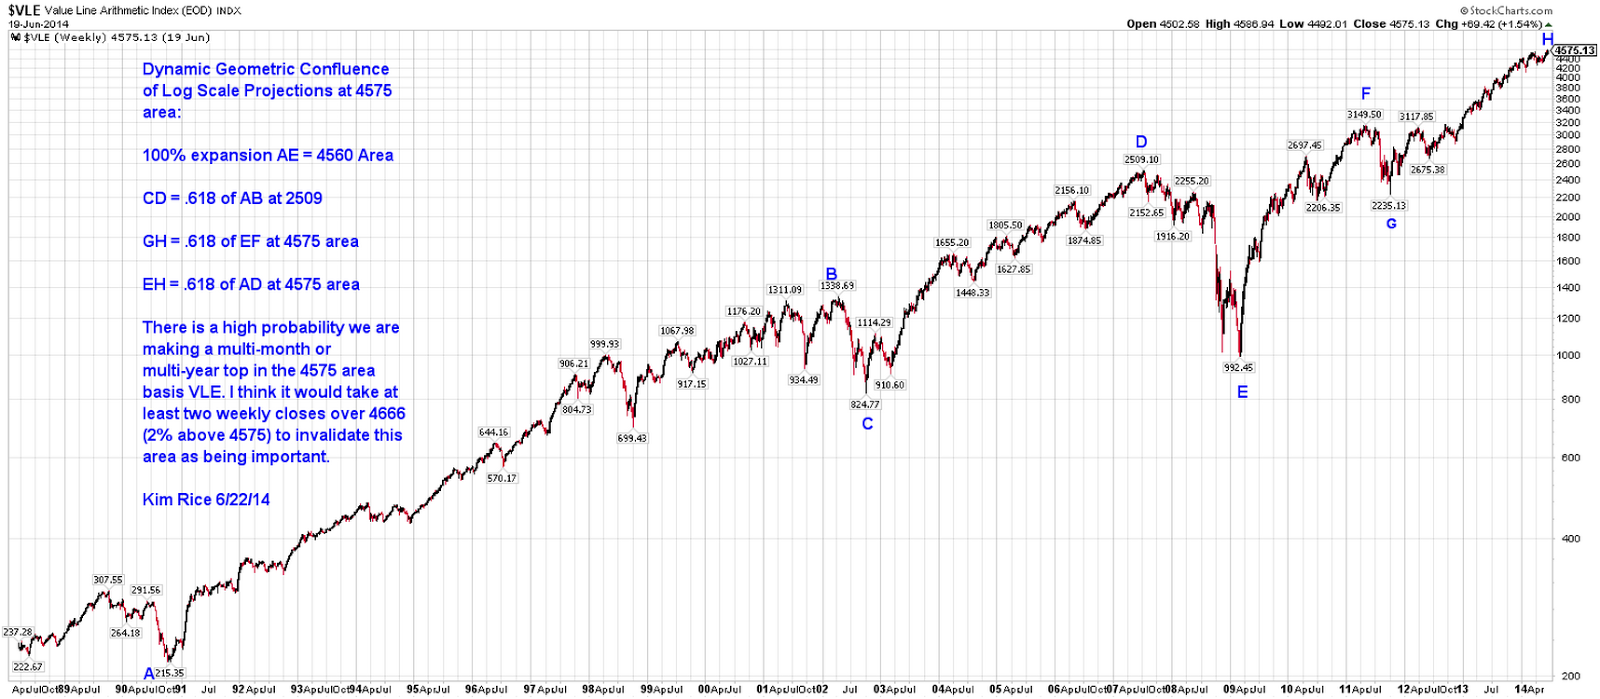
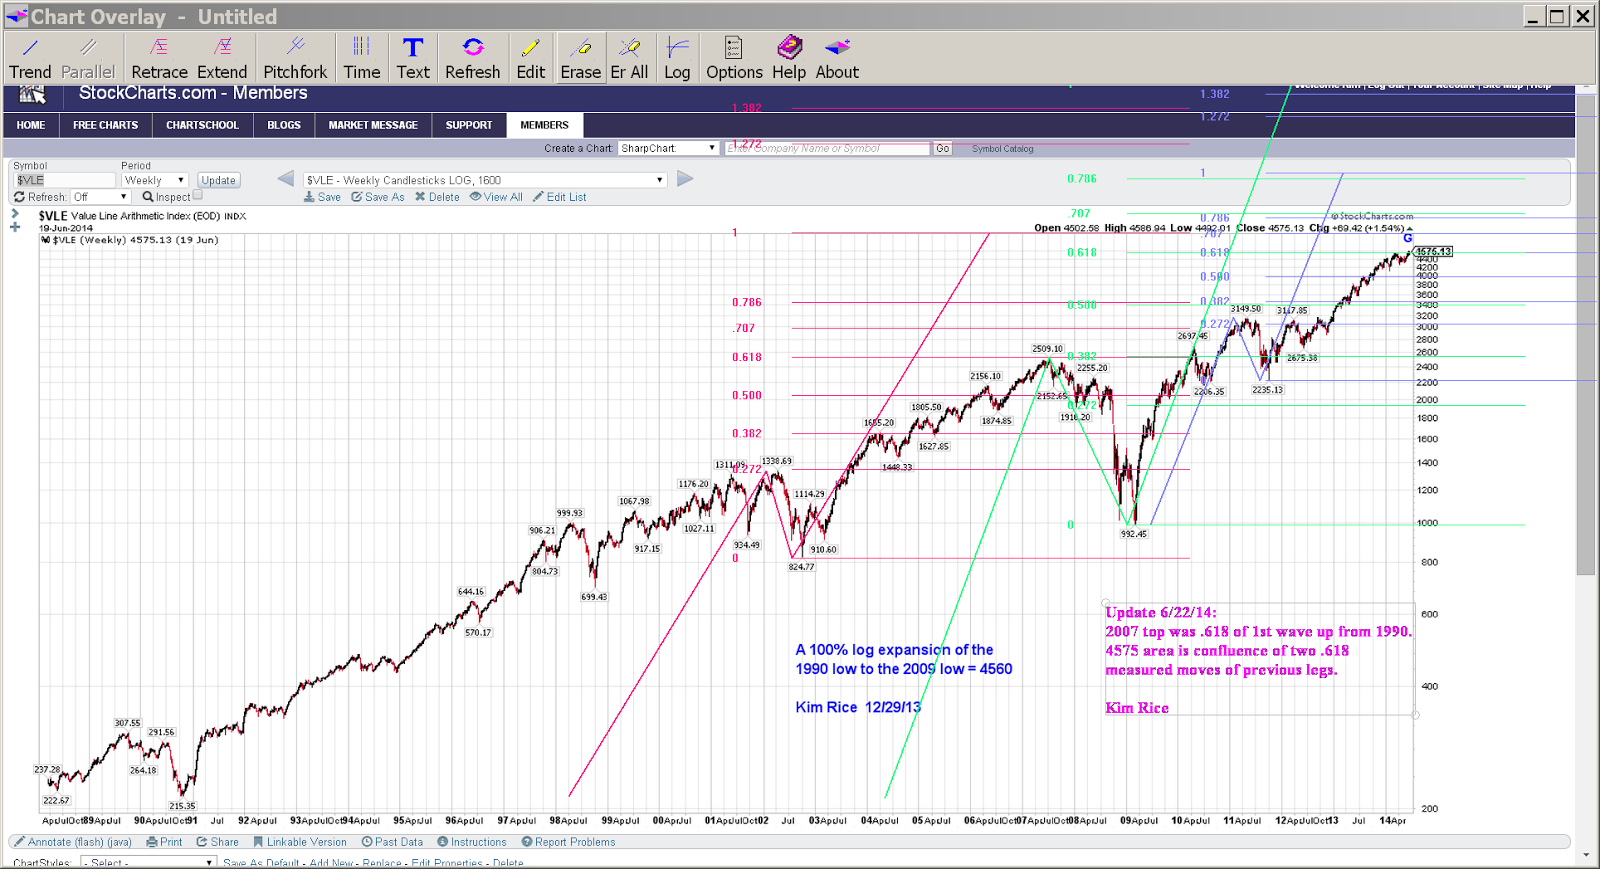
Major Geometric Confluence at 4575 area in Value Line Index
Posted below are several charts showing the dynamic price projections and perfect fibonacci relationships at the 4575 area on VLE, all based on log scale measurements. This is additional, very compelling evidence of a potential major top right at or near current prices as of 6/20/14. So now we have a major price confluence occurring in the window of the very long-term time projections posted here on 6/15/14. The pattern and wave relationships of the two legs up from the 2009 low appear to be a fractal of the larger two-leg pattern from the 1990 low to the present, and the 2009-2014 legs up appear to be a smaller fractal of the 1990 to 2000 legs up. Under the multiple fractal scenario, the correction from May to Oct of 2011 is the small fractal of the 2007 to 2009 down leg, and this presumed top in 2014 is at least equivalent to the 2007 top.
Analysis and additional comments are annotated on the charts posted below.
Kim Rice 6/22/14


Analysis and additional comments are annotated on the charts posted below.
Kim Rice 6/22/14

Wednesday, June 18, 2014
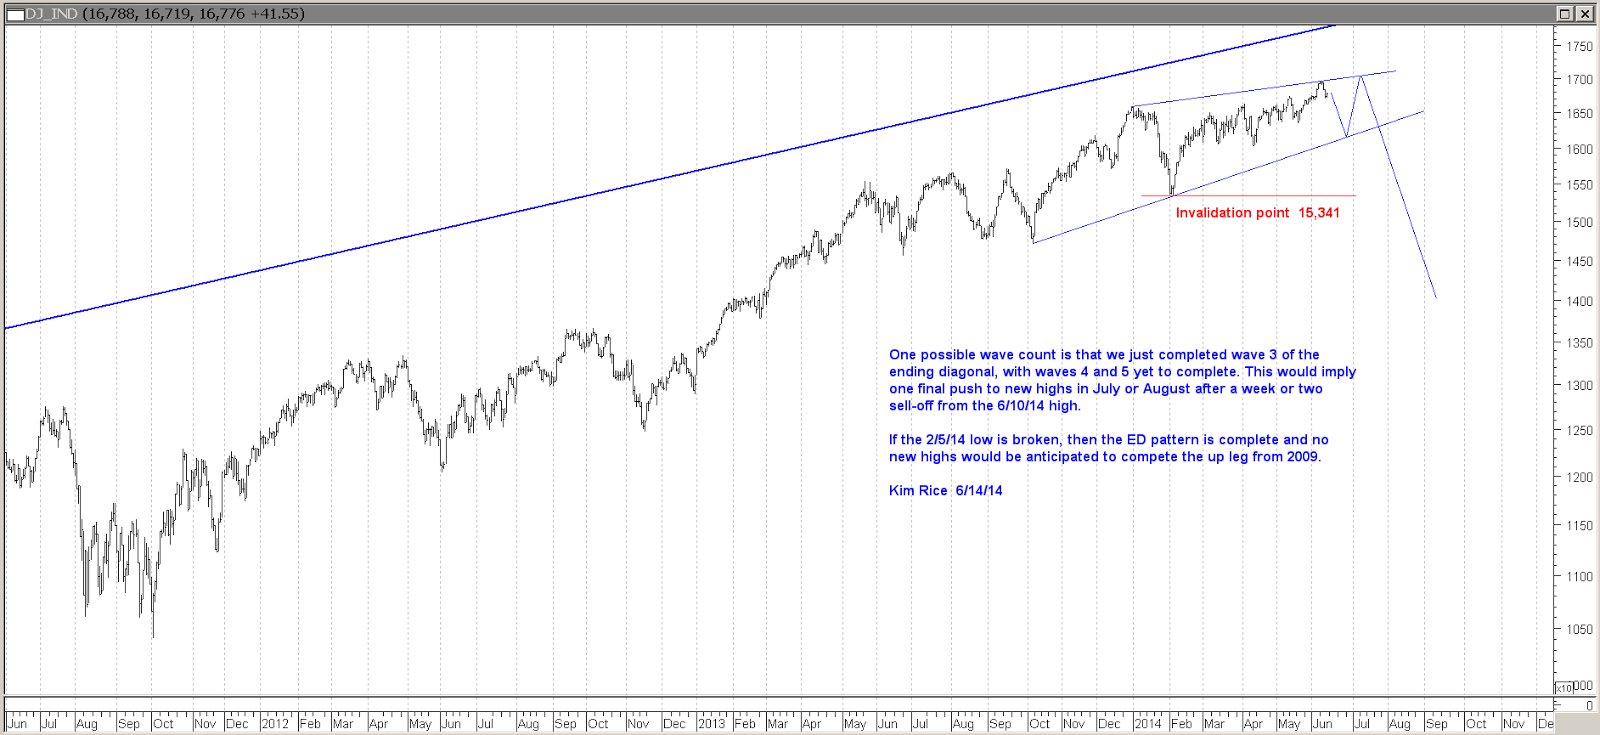
DJIA Ending Diagonal Still Valid - For the Moment
Posted is an update of the DJIA with comments and analysis annotated on the chart.
Kim Rice 6/18/14

Kim Rice 6/18/14

Sunday, June 15, 2014
9972 Trading Day Symmetry in Stocks
The first chart posted below shows the very long-term picture of the DJIA with a potential important time symmetry at 6/10/14. The 9972 trading-day time period matches the 1932 to 1968 period but the number itself is also interesting because it's a factor of two different multiples of phi (161.8 x 61.63 = 9972). I think this adds to evidence of an important top being made. I would guess it's a fairly high probability that 6/10/14 marked the top of the bull move from the 2009 lows.

However, per the following chart, I would guess there's at least a 10 to 20 percent chance that the DJIA and SPX make one more push to new highs unless those indicies break the Feb 2014 lows.
Of course there is always a chance that all of this analysis is incorrect and the market just continues on up without a significant correction.
Kim Rice 6/15/14
Sunday, June 8, 2014
Potential Terminal Patterns and Invalidation Points
With the blow-off in stocks the last few days occurring on good news with a backdrop of extremely bullish sentiment readings, it appears a lot of indicies may be completing terminal patterns. The 6/3/14 projected swing high inverted and became a swing low, which is most evident in the Russell 2000 chart.
Timing wise, something I hadn't posted earlier may be important. 6/6/14 is 1440 (144x10) tds from the 9/19/08 spike top and 550 (55x10) tds from the 4/2/13 top. This presents a compelling Fibonacci time relationship. Historically, this sort of order-of-magnitude Fib time-series relationship has marked some important turns. I have no idea if it will have an impact in this blow-off environment, but sentiment seems ripe. We'll see.
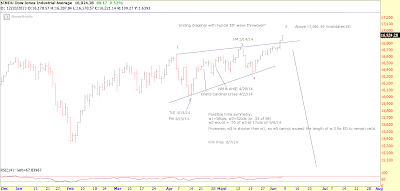
Following is an update to the ending diagonal count on the DJIA posted recently. Since the market never pulled back and now appears to be in a 5th wave thrust over the upper trendline, I've modified the count a bit and noted the invalidation level on the chart.
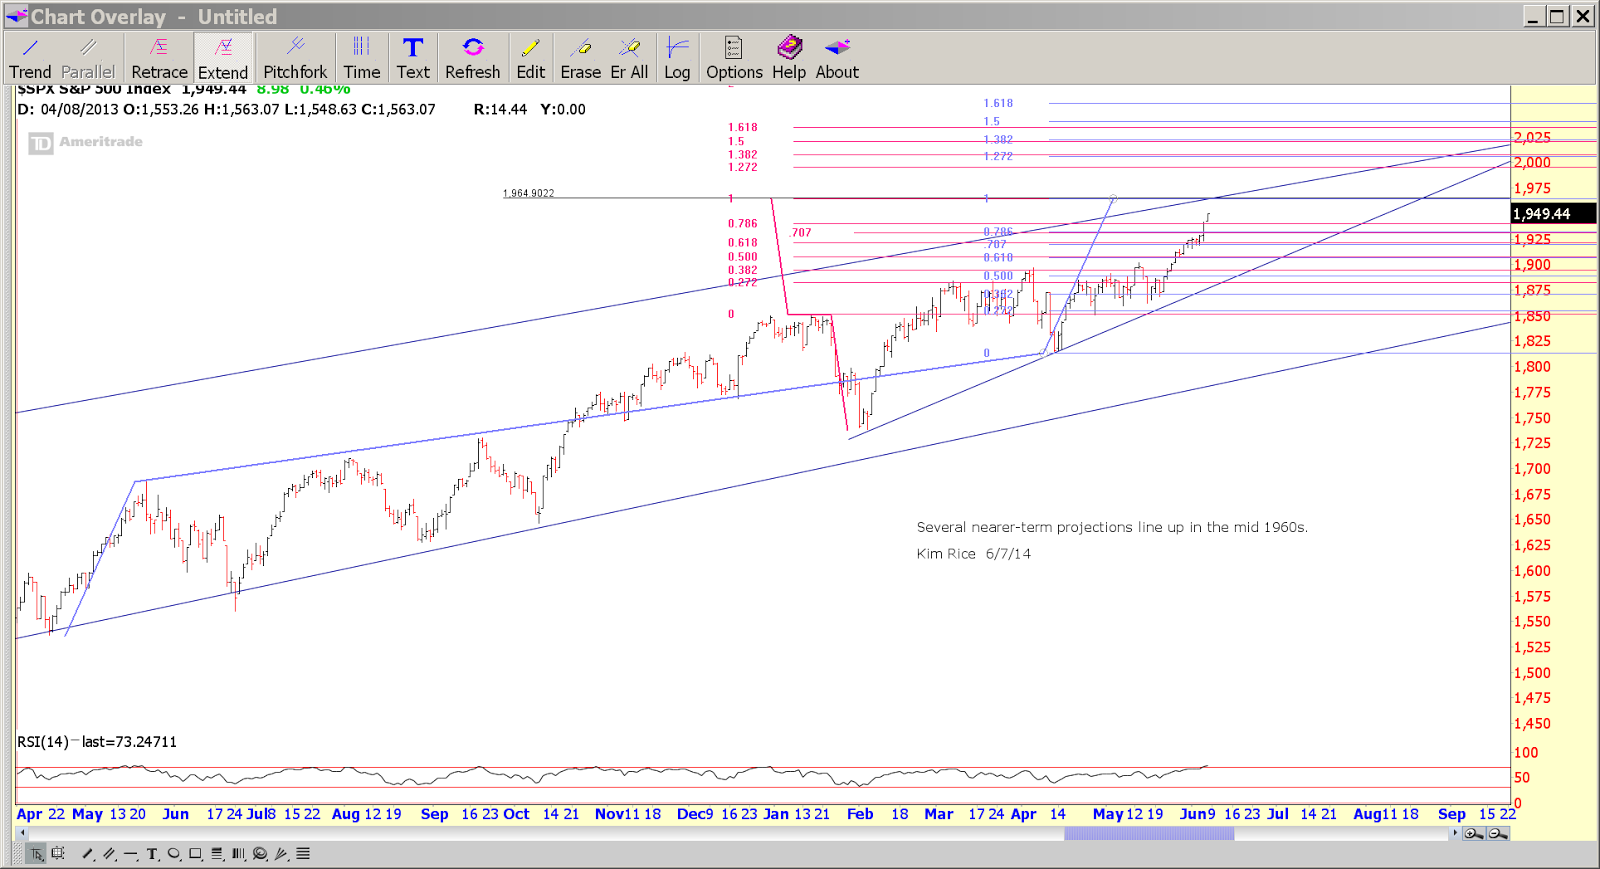
The count on the SPX has different swing points but also appears to be an ending diagonal.

The following two charts of SPX show some additional geometry and trendlines that typically would indicate at least short term reversal points, if not the final waves up in the markets. In my analysis there are potentially important projections to 1950 area and, if that is exceeded, the 1965 area looks particularly interesting.


The SOX Index has an incredibly large divergence with most other indicies - it is nowhere near all-time highs. It has multiple projections for a potential intermediate or long-term top in the 630 area (+/- 10 points), which is not too far above Friday's close.


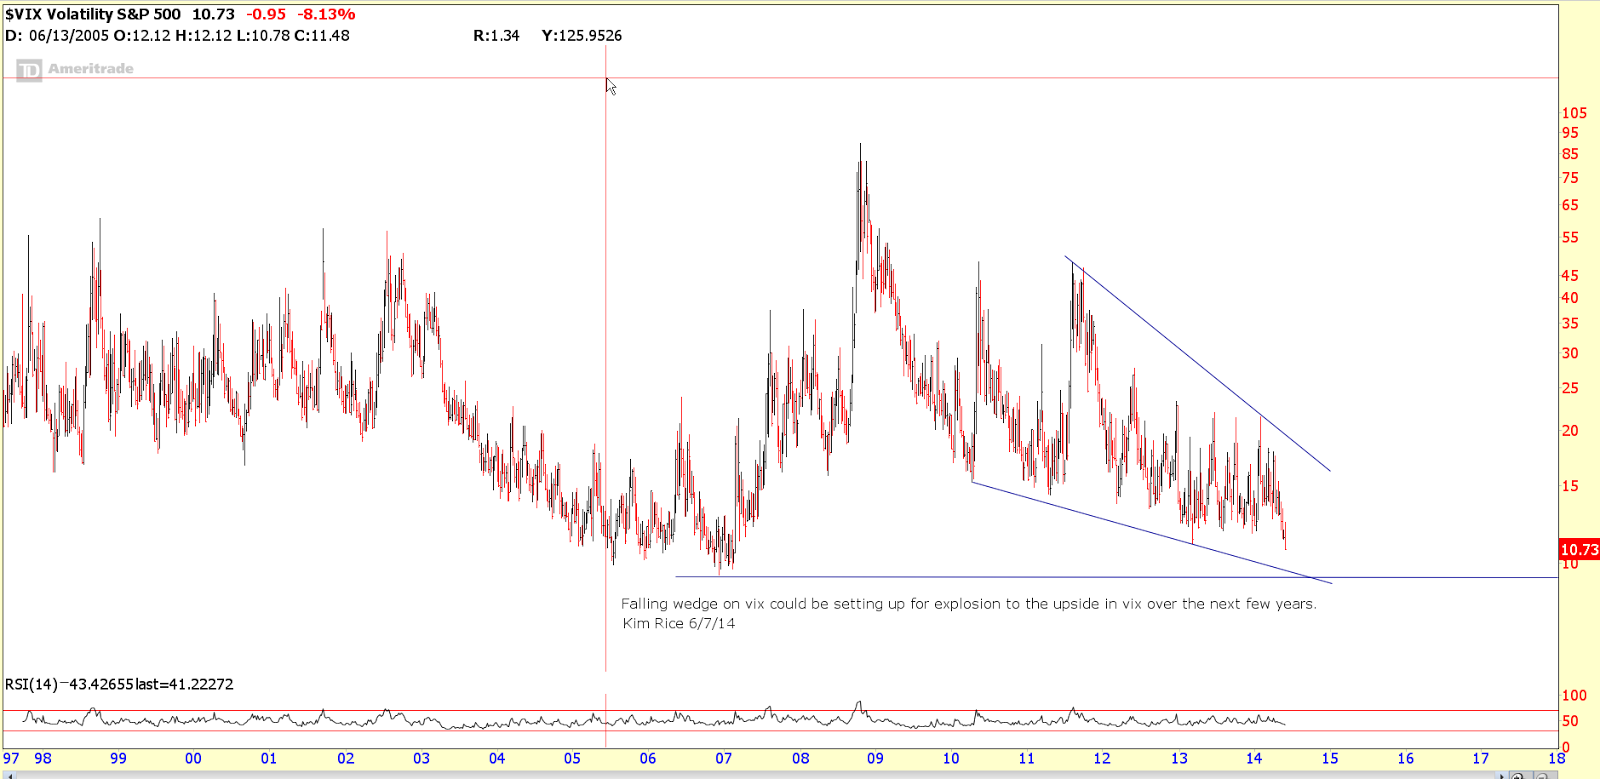
Lastly, the VIX chart also appears to be in a terminal falling wedge pattern that is almost complete. If that pattern is correct, it implies the VIX will move much higher in the coming months.
Kim Rice 6/8/14

Timing wise, something I hadn't posted earlier may be important. 6/6/14 is 1440 (144x10) tds from the 9/19/08 spike top and 550 (55x10) tds from the 4/2/13 top. This presents a compelling Fibonacci time relationship. Historically, this sort of order-of-magnitude Fib time-series relationship has marked some important turns. I have no idea if it will have an impact in this blow-off environment, but sentiment seems ripe. We'll see.
Following is an update to the ending diagonal count on the DJIA posted recently. Since the market never pulled back and now appears to be in a 5th wave thrust over the upper trendline, I've modified the count a bit and noted the invalidation level on the chart.

The count on the SPX has different swing points but also appears to be an ending diagonal.

The following two charts of SPX show some additional geometry and trendlines that typically would indicate at least short term reversal points, if not the final waves up in the markets. In my analysis there are potentially important projections to 1950 area and, if that is exceeded, the 1965 area looks particularly interesting.

The SOX Index has an incredibly large divergence with most other indicies - it is nowhere near all-time highs. It has multiple projections for a potential intermediate or long-term top in the 630 area (+/- 10 points), which is not too far above Friday's close.


Lastly, the VIX chart also appears to be in a terminal falling wedge pattern that is almost complete. If that pattern is correct, it implies the VIX will move much higher in the coming months.
Kim Rice 6/8/14
Wednesday, June 4, 2014
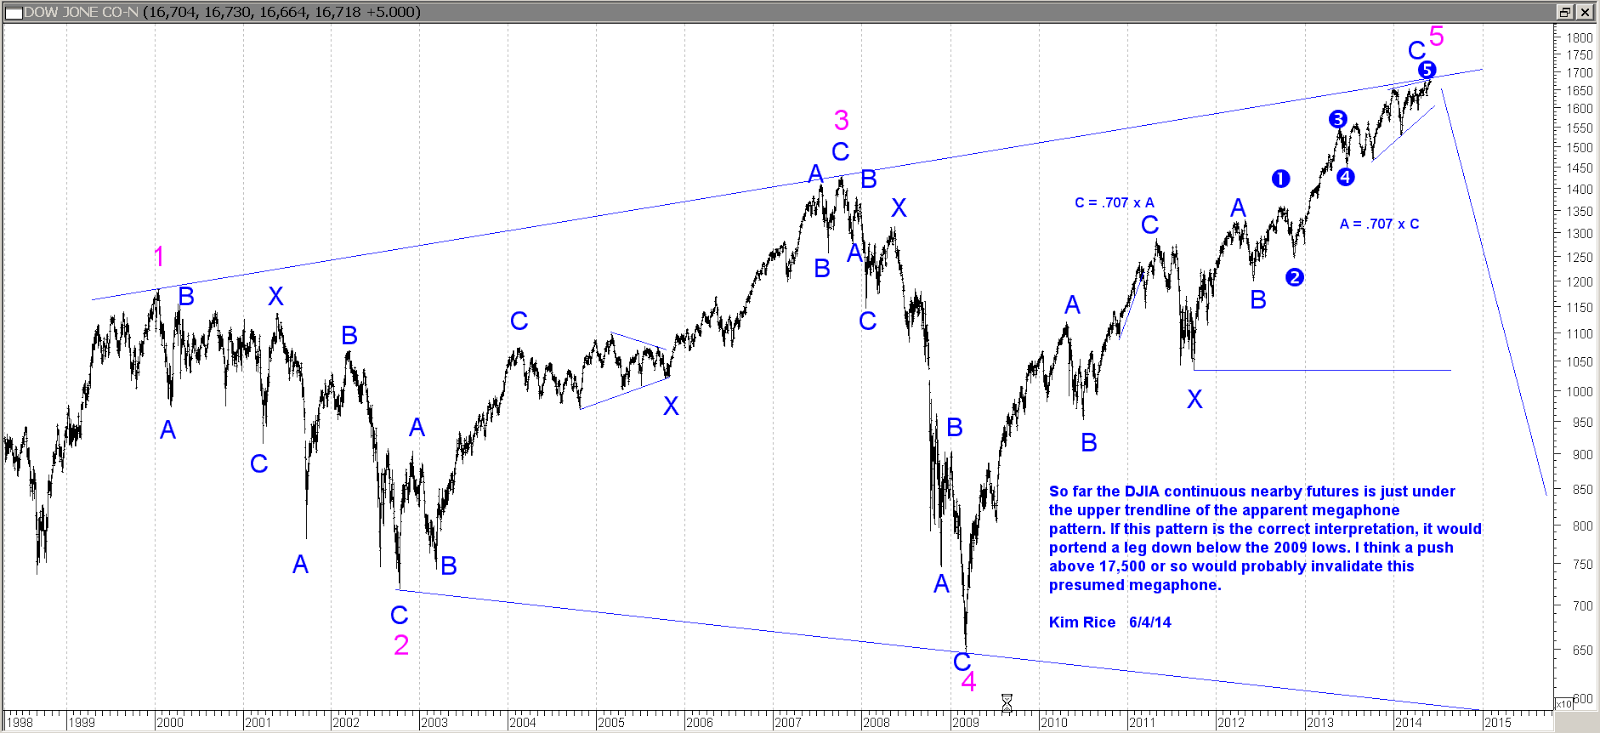
DJIA Megaphone Update
Posted below are charts showing an update to the presumed megaphone pattern in the DJIA. The first is the long term view. The second chart shows a zoom in of the current price action. Analysis is annotated on the charts.
Kim Rice 6/4/14


Kim Rice 6/4/14

Monday, June 2, 2014
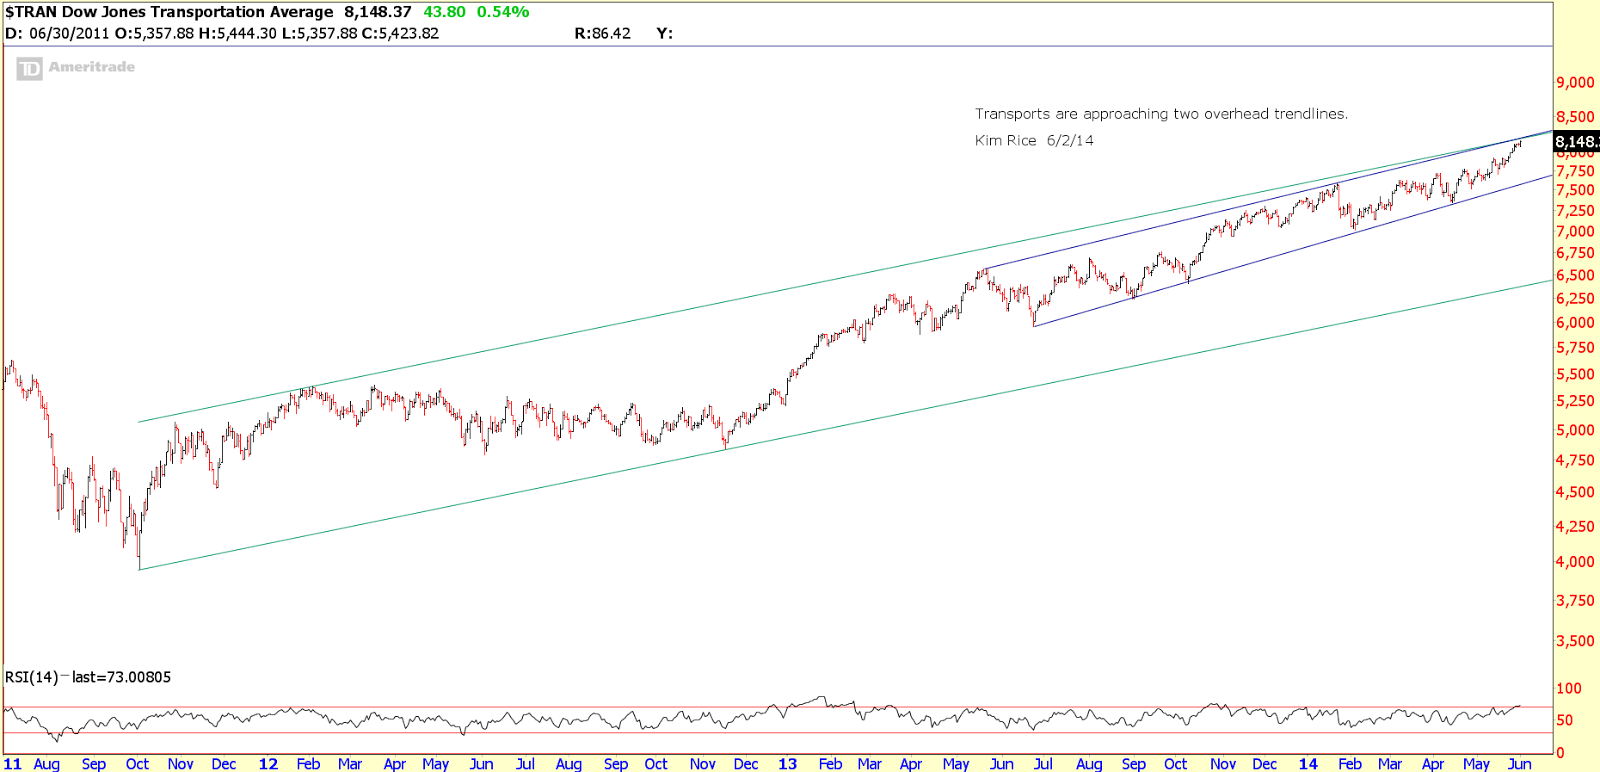
Transports and Trendlines
The DJT index has been about the hottest sector around and is rapidly running up to two separate trend-lines that converge in the 8170 to 8200 range. We'll see fairly soon if this area acts as resistance just as we are coming into a timing window for a potential reversal 6/3/14 (+/- a day or two).
Kim Rice 6/2/14

Kim Rice 6/2/14
Sunday, June 1, 2014
Potential Short-Term Swings in Russell Following Projected 6/3/14 Top Window
This is a follow-up to the previous blog post. No time for a chart, but additional analysis points to a potential swing low on or near 6/10/14, followed by a rally back up near or above the 6/3 top (if there is a top in the 6/3 window). If a rally does ensue out of the 6/10 area, I would look for final swing highs around 6/16/14 before the larger swing down into the 7/10 to 7/11 area (+/- a trading day or two). As mentioned in earlier posts, I'm doing analysis and projections using the Russell 2000 lately, which is what these current projections are based on. The way the SP keeps levitating, I wouldn't be surprised if 6/16/14 window brings a new all-time highs while the Russell should not get much above the 50-70 percent retrace area of the decline since March. As usual, any of the projected turns could invert regarding the polarity. So, whichever way the market is trending into a CIT date, I would look for evidence of a reversal in trend.
Best guess summary:
Top around 6/3/14
Low around 6/10
Top around 6/16
Then larger decline into 7/10-11 area.
Kim Rice 6/1/14
Subscribe to:
Posts (Atom)