Wednesday, May 22, 2013

Stock Indices Hit Important Resistance

Posted below is a series of charts that show perfect hits and reversals at important trendline/channel resistance. Per the previous post, I would expect a retest of highs or lower top on or near 6/7/13 before the expected larger down move gets underway.

Sentiment-wise, here's a post I found on someone's blog last week:

"what are the chances of this market going down??? how about Z-E-R-O???"

Kim Rice 5/22/13

Tuesday, May 21, 2013

Stock Timing: Zeroing in on 6/7/13 area for potential top


As annotated on the chart posted below, the timing looks more like 6/7/13 may be the confluence point for a top in stocks. The previous blog post about week of 5/31 alluded to this 6/7 date, and after additional analysis, 6/7/13 (+/- a trading day or two) looks to be very important.

Kim Rice

Sunday, May 19, 2013

Stock Market Time Projections for May/June 2013

Posted below are a couple of charts annotated with analysis of a few time projections for May/June 2013. The first chart shows a confluence based on the weekly chart that lines up for the week of 5/31/13 (+/- a week). It looks like it may be important for a potential market reversal, but timing projections haven't been working well for the last few years. I imagine cycles and other indicators will eventually start working again, but I don't know if that time has come.

The second chart shows a 394 trading day cycle low that has occurred with some panic selling on two of the previous lows. Since we're entering a Puetz Crash Window, I suppose anything is possible. The sentiment is extremely bulled up but there aren't many technical divergences that typically precede significant sell-offs. I think there is more important timing for lows in July 2013, so we'll see soon enough if anything happens around the June 19th-21st area.

Kim Rice 5/19/13

Friday, May 17, 2013

Revised Target for Probable Top in Stocks: Russel 2000 Projections


In analyzing the Russel 2000 (basis the Mini-Russel continuous nearby futures), I found quite a cluster of price projections that point to the 1002/1003 area. As annotated on the chart posted below, I have identified 8 separate sets of swing points that project to a range of 994.30 to 1010.50. The majority of the projections are in the 1002/1003 area, and the average of all projections is 1003.32.

If the Russel gets into this 994 to 1010 price range, I think there is a high probability of a significant reversal in the Russel and other indicies. I am changing my stop on short positions (based on analysis posted re "DJIA - Multi-Generational Top at 15,000?") to a weekly close above 1015 basis the nearby Mini Russel futures, and will probably add to shorts above the 1000 level.

Kim Rice 5/17/13


Update:
I found a 9th projection where two major legs since the 2009 lows will be the same length at 1000 area as shown on the chart below. The range of points 6 to 11 (at 1000.61) will equal the length of points 2 to 3.


Update #2:
It's now up to 11 sets of swing-point projections to the 1000 cluster area. One of the added items is the possible fractal showing in the pink ovals: same percentage gain as 2011 rally leg targets 1000.79. The second chart below shows a close-up of the last few years and price action in the pink ovals.

Sunday, May 5, 2013

Stocks: More Timing Analysis with Potential Turn in May 2013


Posted below are a few more charts showing various linear and non-linear time analysis for stocks, all of which points to a potential turn in May 2013 (except for one projection to the first week or so of June).

There is a new moon on 5/10/13, and a solar eclipse as noted on previous blog post, which corresponds with timing projections I posted on 4/16/13.

Kim Rice 5/5/13

Saturday, May 4, 2013

Entering a Puetz Crash Window for Stocks in May - June 2013


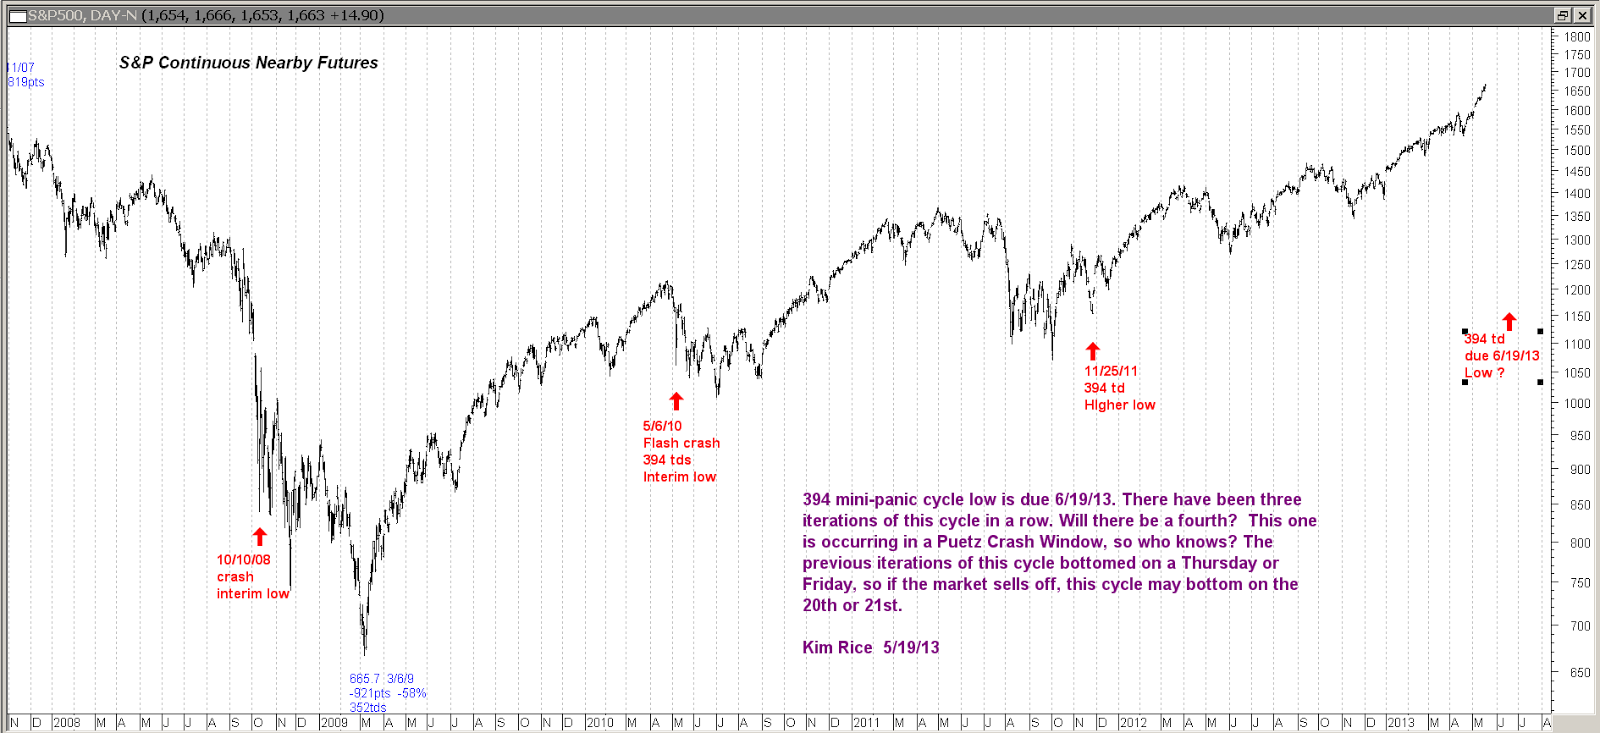
Steve Puetz studied a lot of market history regarding crashes and their proximity to solar and lunar eclipses. Crashes don't always occur in a "Crash Window", but pretty much all crashes that have happened occurred in a Crash Window.

Puetz used eight previous crashes in various markets from the Holland Tulip Mania in 1637 through the Tokyo crash in 1990. He noted that market crashes tend to be lumped near the full moons that are also lunar eclipses. In fact, he states, the greatest number of crashes start after the first full moon after a solar eclipse when that full moon is also a lunar eclipse. Once the panic starts, Puetz notes, it generally lasts from two to four weeks. The tendency has been for the markets to peak a few days ahead of the full moon, move flat to slightly lower --waiting for the full moon to pass. Then on the day of the full moon or slightly after, the brunt of the crash hits the marketplace. You can read more about Puetz Crash Windows at the Spirit of Truth blog.

As annotated on the charts below, the current configuration and spacing of solar and lunar eclipses is virtually an exact match to the configuration and spacing of eclipses in 1987 just prior to that market meltdown. I would say the major caveat that might argue against a crash in the late May to early July time frame is that this Crash Window is not occurring in the Fall of the year. Historically most, but not all, serious crashes occur in the Fall. We'll see soon enough.

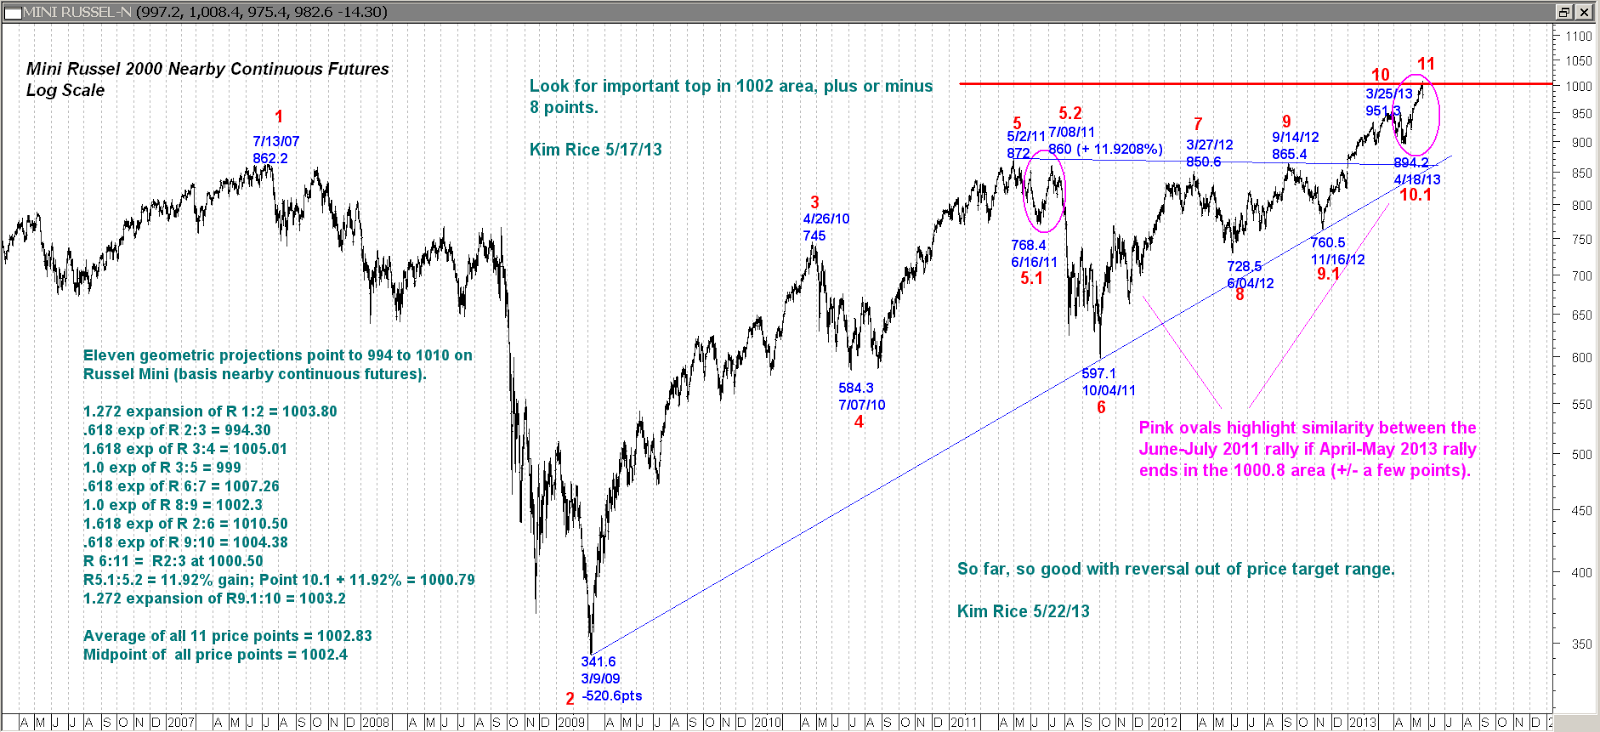
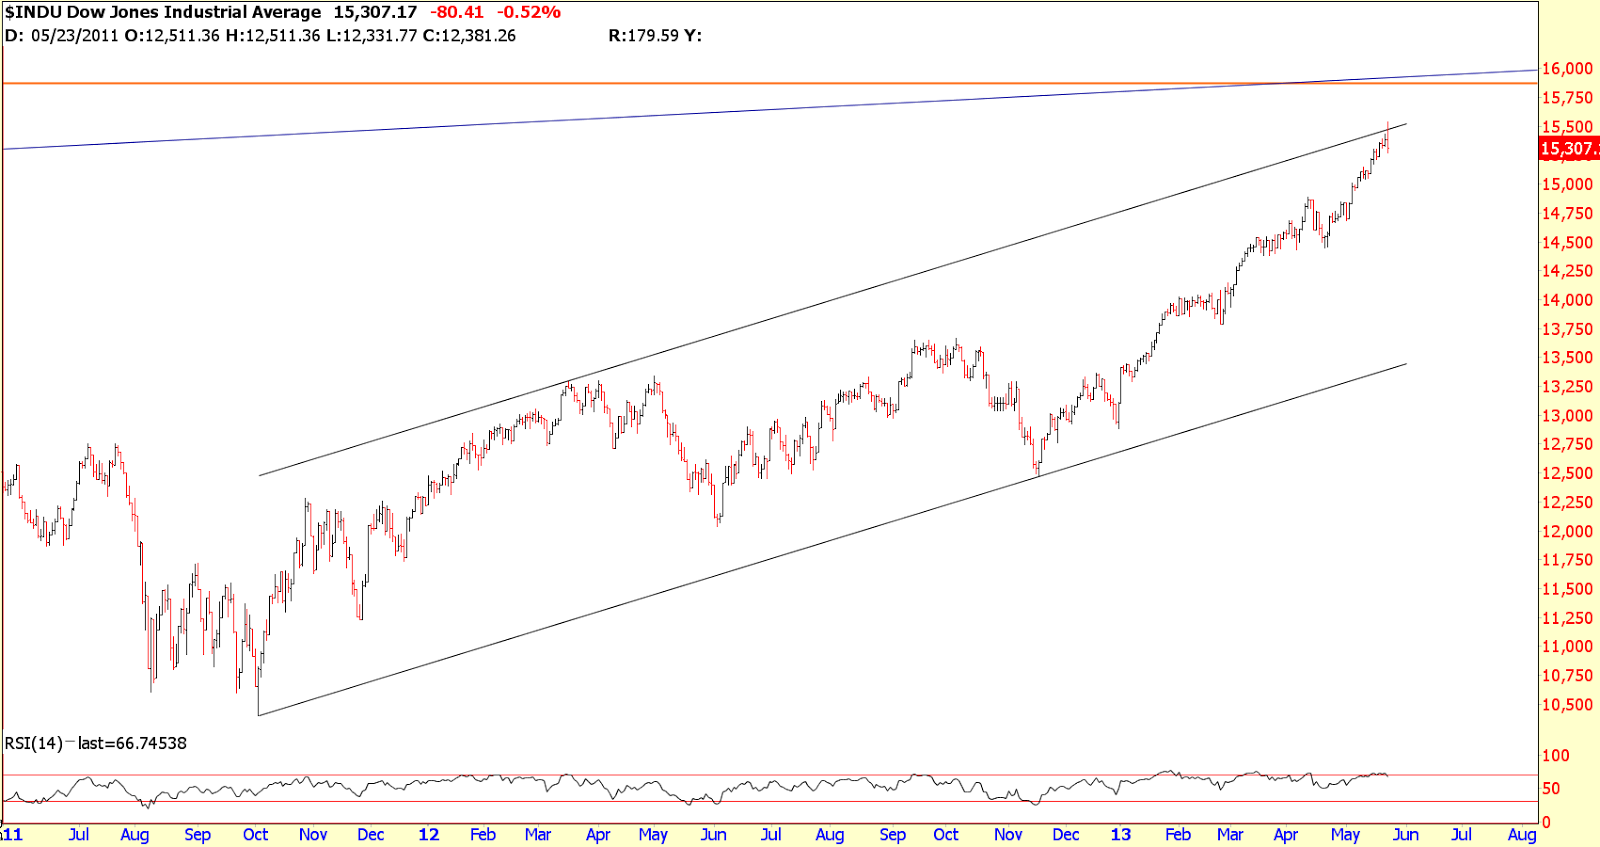
The DJIA cash did hit the big 15,000 target for potential major top as posted earlier. Traders should be on maximum alert for a possible top and crash in the markets.

Kim Rice 5/4/13