Tuesday, April 30, 2013

Dollar Fractal Update and E-Wave Count

This is an update to the post back in December 2012 about a potential dollar fractal play.

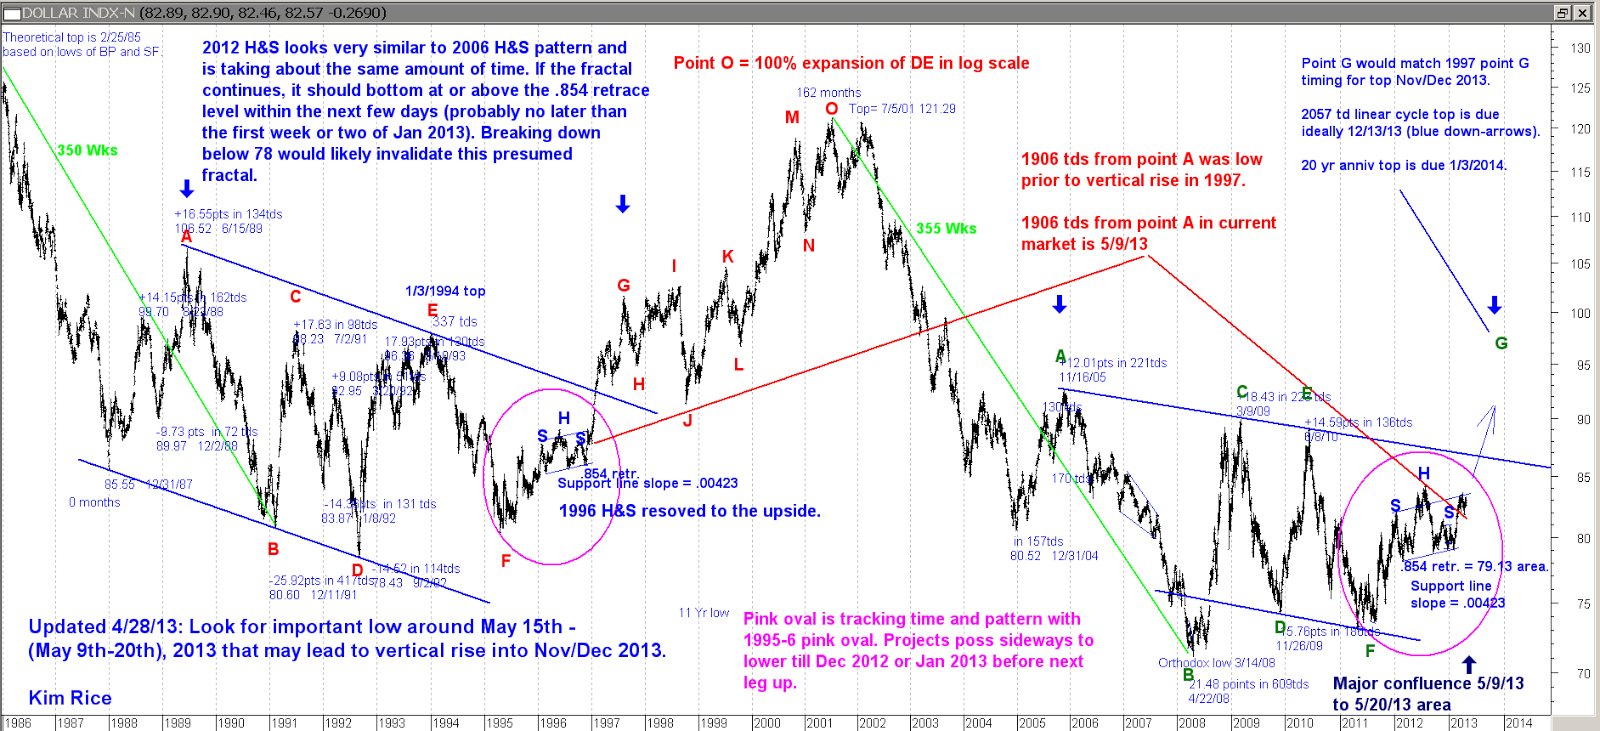
Per the updated chart below, it looks like the dollar is still generally tracking the base fractal from the 1990's. However, the current correction is deeper than the same point in the earlier pattern. Based on timing analysis, cycles should bottom and turn up sometime between May 9th and May 20th, 2013 (ideally, May 15th). IF the fractal continues to track, the dollar should begin a mult-week vertical rise out of the May low, whenever it actually occurs.

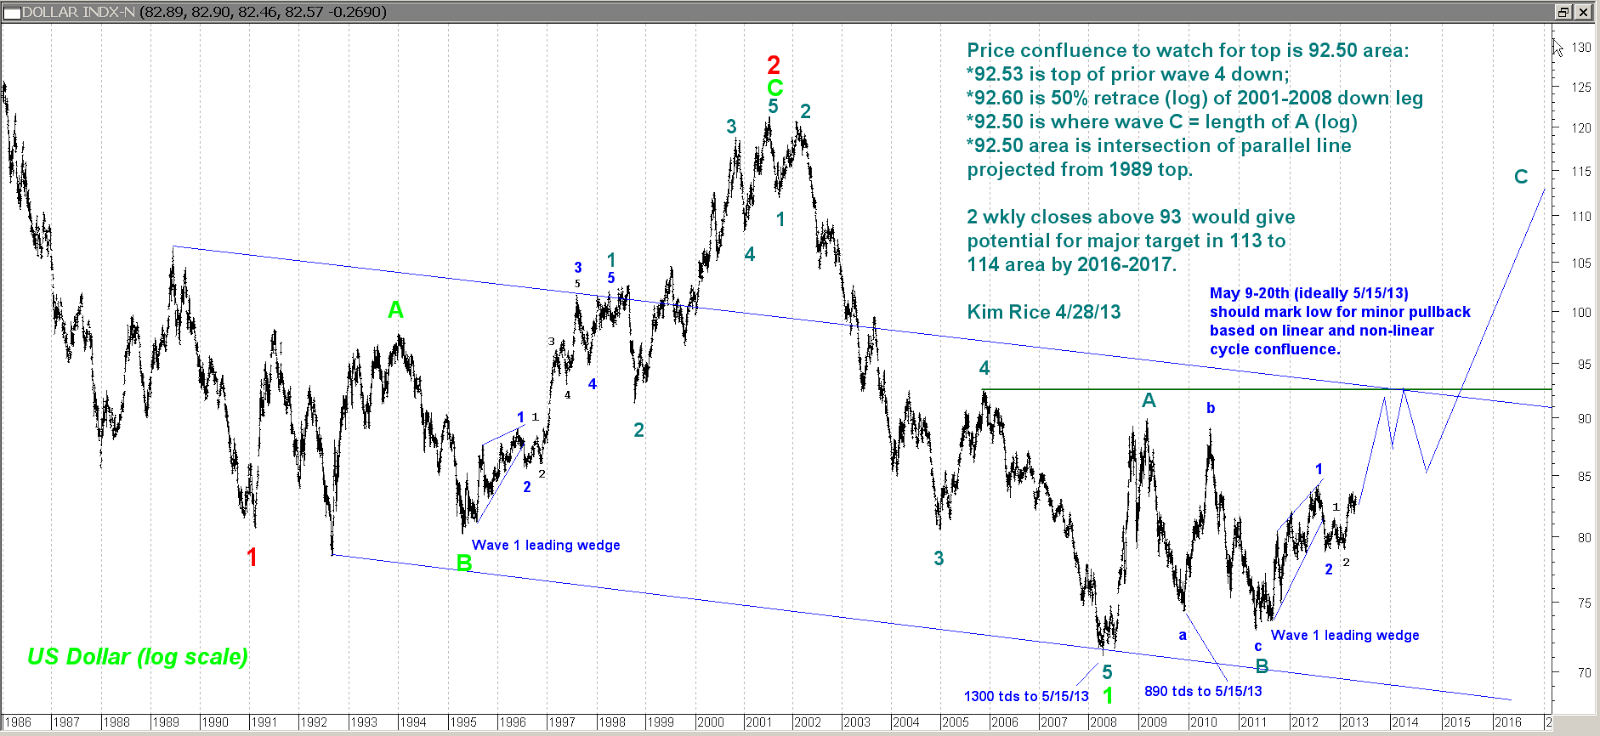
Also posted is the dollar chart with my best guess at the Elliott Wave count, which aligns with the idea of a large up-move starting after current correction is done.

We'll see fairly soon.

Kim Rice 4-30-13

Tuesday, April 16, 2013

Timing Confluence to Watch for Stocks: May 8th to 10th, 2013

Historically, price projections have been much more important and reliable for marking market turns than cycles or time projections. Market timing projections have not worked well for several years, so I'm not sure what weight I would assign to the analysis shown on the chart below. There is quite a lot of interesting time symmetry in the proportional relationships between various waves since the 2009 lows. Whether or not this May 8-10 area will mark a turn in stocks, I don't know. However, if the DOW rallies into that time window and happens to be in the 15,000 area when doing so, we would have a price and time confluence. This would increase the likelihood of an important top at or near 15,000 on the DJIA. As noted on the previous blog post, 15,000 on the DOW looks very important. As it stands right now, I will be adding to short positions any time the DOW hits 15,000, whether it's in this May timing confluence or not.

Kim Rice 4/16/13

Sunday, April 14, 2013

DJIA: Multi-Generational Top at 15,000?

Well, cycles and other timing confluences haven't worked for market turning points in the land of quantitative counterfeiting for the last few years. I guess we'll find out soon if major price projection confluences will work to mark turns in the market.

Posted below are some very long-term charts showing geometric price projections and Elliott Wave counts that all line up with the potential for a major, multi-generational top in the 15,000 area of the DJIA cash index. If these projections are going to mark a major top, and giving this a 2% margin of slippage, I would expect the top to occur at 15,000 +/- 300 points. As of last week, the Dow is in this window. As noted on the two charts, splitting the difference between the two projections (14,983 and 15,017) arrives at exactly 15,000. I would think if 15,000 is going to be THE top, the market would probably break through that level a bit so the papers and CNBC could celebrate: "DOW Hits 15,000!!!!". But it would be interesting if it did peak at exactly 15,000. A guy can dream can't he?

Kim Rice 4/14/13