As posted
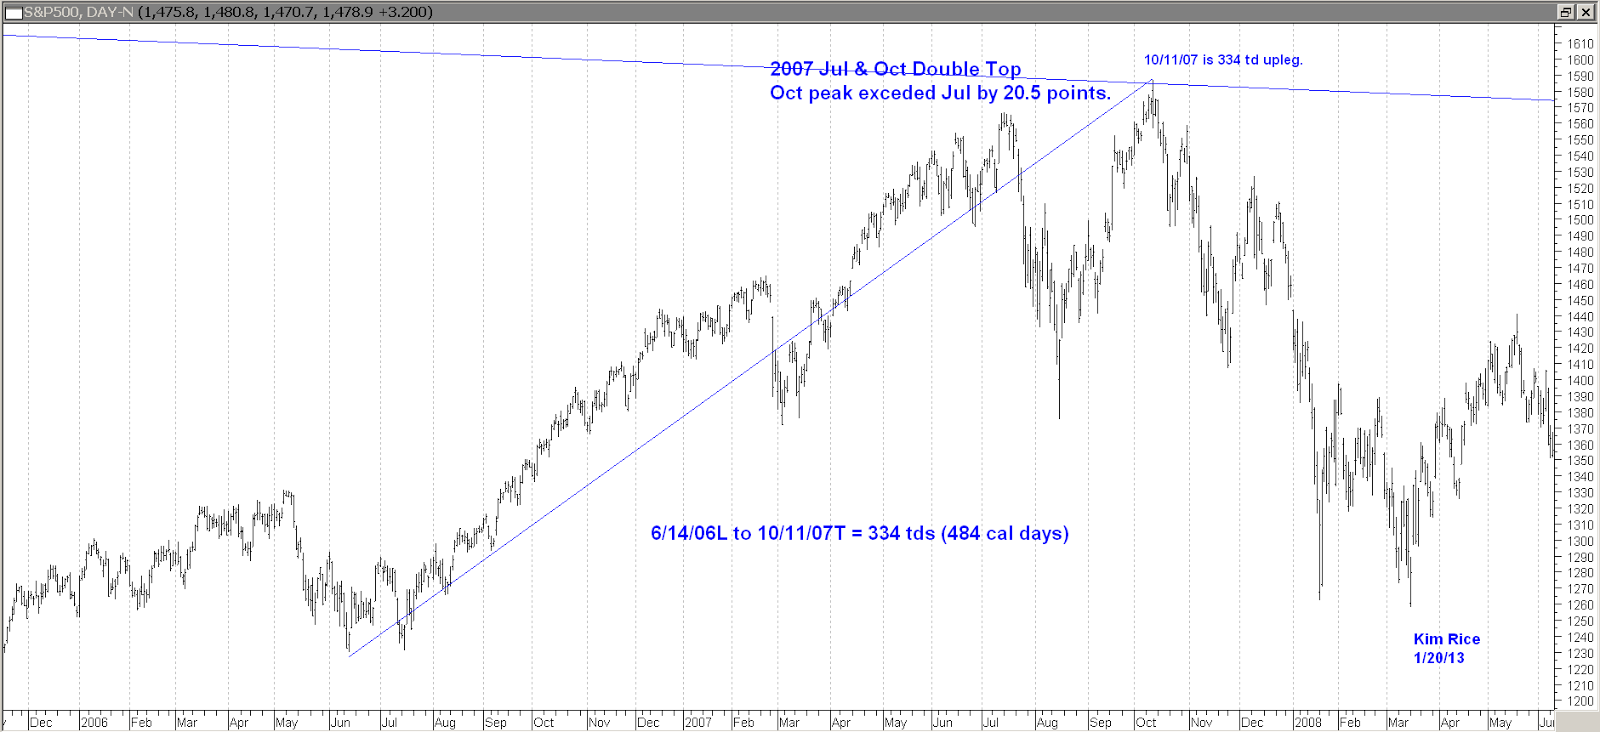
here a weeks back, there is a major timing confluence in stocks due late Jan to early Feb 2013. After a few more weeks of market action and conducting more analysis, it appears the most likely timing for an important turn is 1/30/13 (+/- a couple trading days). Earlier guess was that early Feb would mark a low, but as we approach that window it is most likely heading into a top. I think the top is very similar to the 2007 double top per annotations on some of the charts posted below.
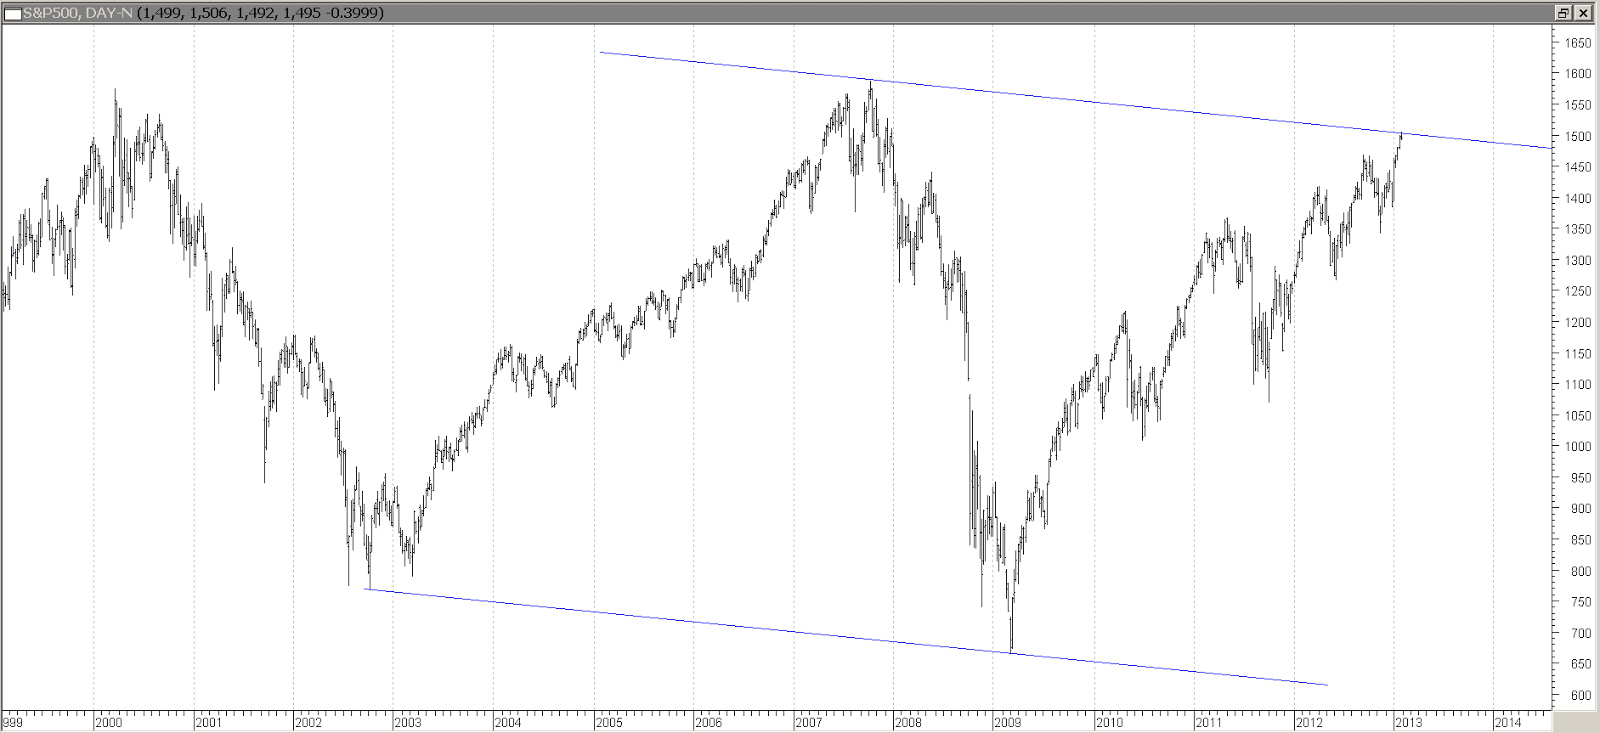
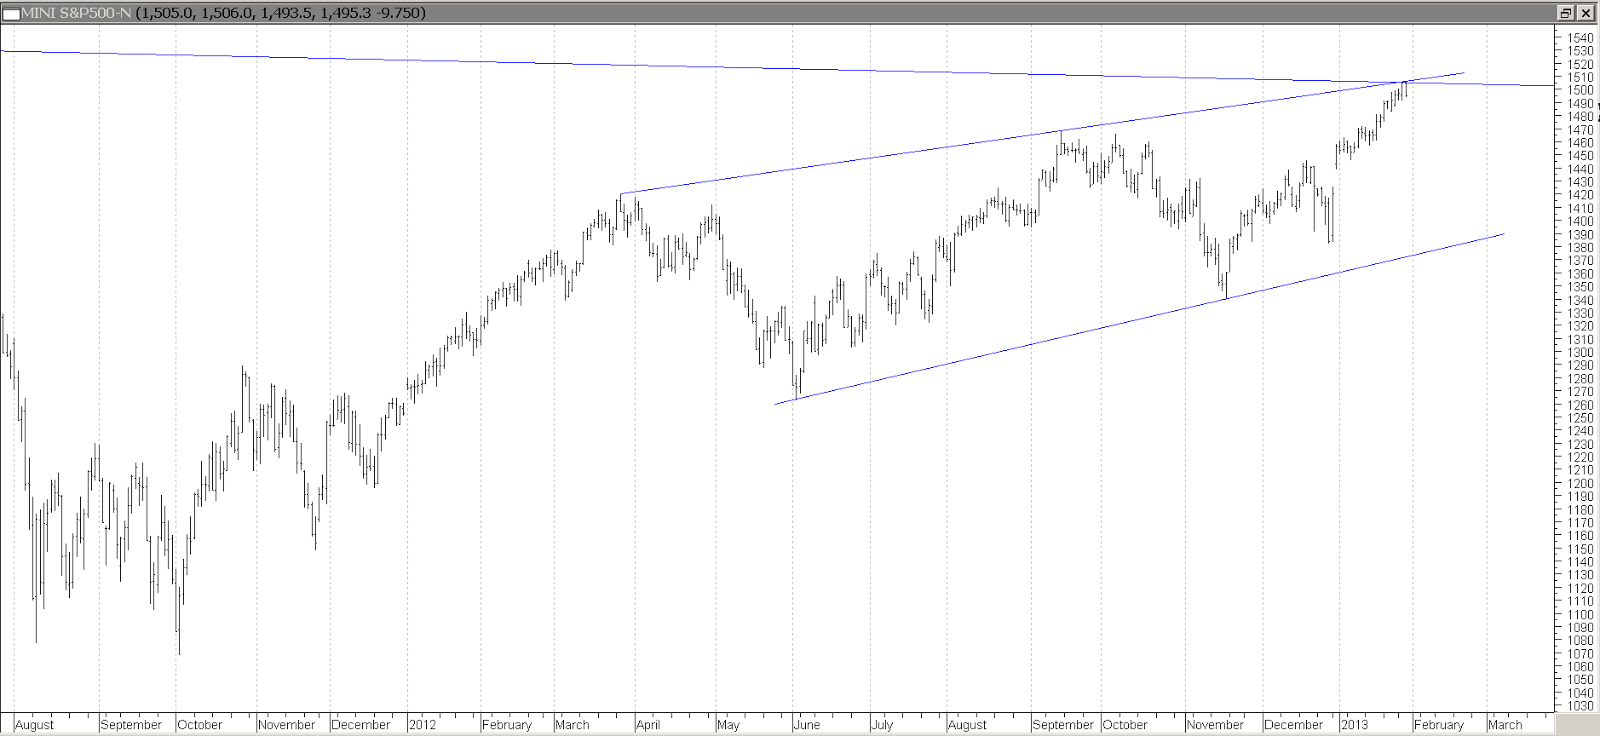
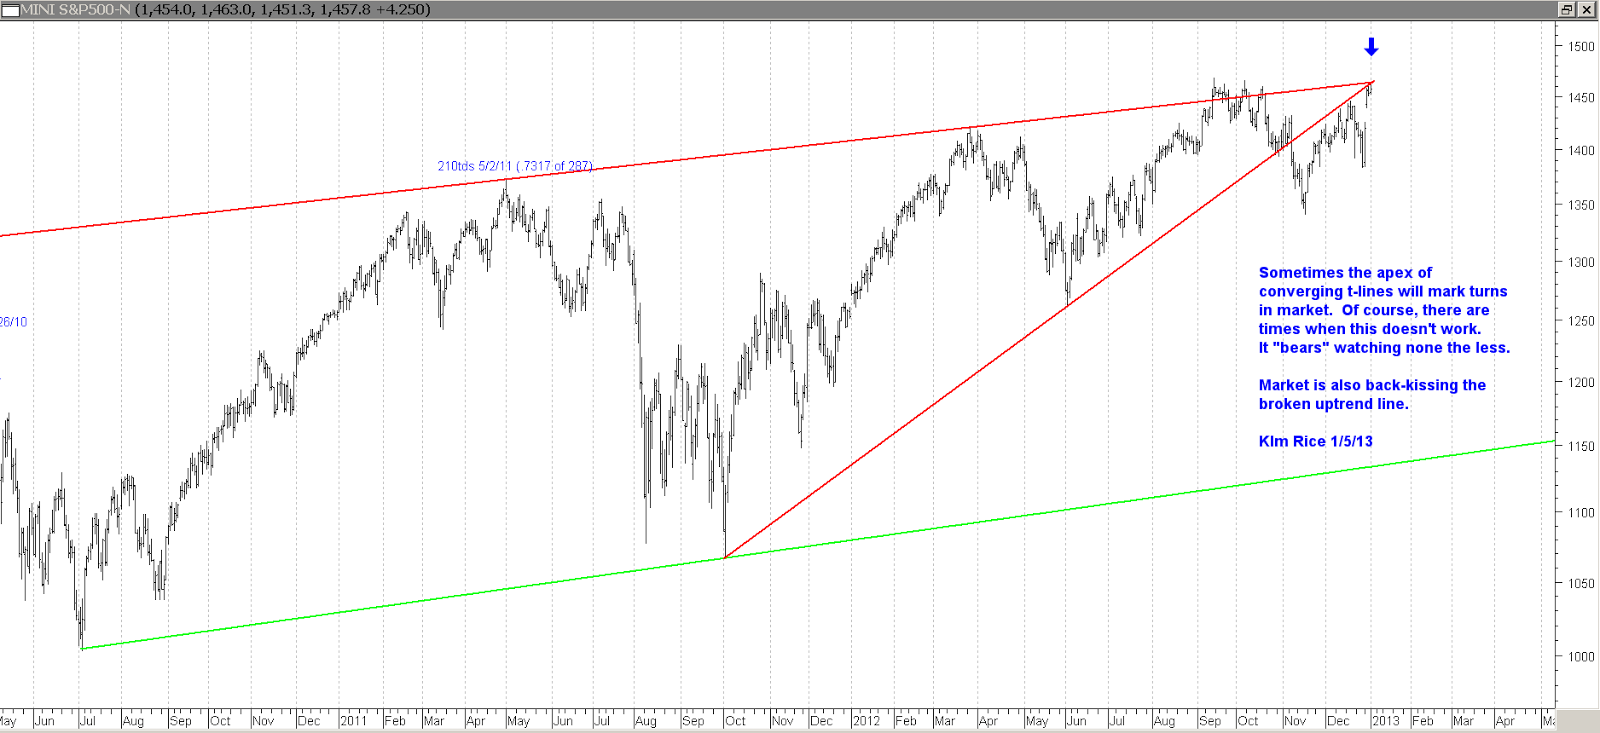
As shown on the charts, there are multiple methods of timing on daily and weekly charts that point to this 1/30/13 area time window. One that looks particularly interesting is the 334 trading day up-leg from 10/04/11 matches the duration of the last up-leg leading to the 2007 top. After redrawing the upper trend line of the rising wedge (to line up with 9/14/12 peak instead of 4/2/12 peak), the apex now lines up with the end of January as well. Lastly, the Fibonacci time series from the 3/6/09 low has the next point in the series lining up in this confluence window as well.
Sentiment is at extremes and VIX is at lows not seen since the 2007 top. There are numerous divergences showing up as the SP and Dow Indices moved above the 9/14/12 highs last week, while the NDX is still quite short of the September high. The RSI divergence on the weekly chart is almost an identical set-up as occurred at the 2007 top.
Price-wise, the last projections nearby are 1485 to 1488 area basis the nearby E-mini S&P continuous futures contract (see analysis annotated on charts below). If the E-mini SP closes above 1490, it may move as high as 1550 which is the next confluence of price projections. Wherever it's going to peak, I think it needs to get there no later than the week of February 8th, and most likely the week of February 1st.
I would highly recommend reviewing some very comprehensive long-term technical analysis prepared by Garrett Jones and some cycle work by Peter Iliades. Both of them have analysis that is looking for a major top in Jan/Feb window. You can find a Garrett Jones audio interview and his charts
here. Peter's analysis is on line
here.
Kim Rice 1/20/13
The first chart shows the divergence in the NDX not making new highs above September top.
The rest of the charts are annotated with analysis and comments.