Thursday, May 14, 2015
Next Major Timing Confluence for a Possible Top in Stocks
So far, my previously-posted price projections have not been hit. I am still waiting on the sidelines for these price targets to be achieved with a rally into one of my timing targets.
My very long-term timing analysis shows a high probability of an important reversal the week of 6/12/15 (+/- a few trading days). This includes a 1713 week cycle and a 2113 week cycle that both converge the second week of June. At this point I'm assuming we will trend up into this timing (zigs and zags notwithstanding), which would be a requirement to mark a top.
Price-wise I have two major targets basis SPX: 2157 and 2200-2210 area. Hitting the 2150 to 2210 area in the above mentioned time window would constitute a mega price and time square in my work.
If this potential setup occurs, I think there is a reasonable chance it could lead to the evasive, long-preempted 20 percentish (or larger) correction in stocks in the second half of 2015. One must keep in mind this would be a bet against sociopaths at central banks who seem hell-bent on keeping this Ponzi Scheme going with liquidity created out of the ether.
Kim Rice 5/14/15
Sunday, March 22, 2015
Update to Analysis for Major Inflection Point in Stocks
I'm still waiting for price targets to get hit, hopefully at or near one of my time projections in March or April. I'm staying with the analysis in the last blog post, but have a few more potential targets to add for cash SPX as follows:
2210.5 area is where the two legs up from the 2009 low will be of equal length in log scale.
2220.4 is where the percentage gain from 2009 low equals the percentage gain from 1982 low - 1987 top(233%).
Additionally, I'm starting to lean toward the notion that this upcoming presumed top will not be the final highs that kick off a major long-term bear market. I think we may be ending a wave 3 in the next few days to weeks to be followed by wave 4 down for several months and then the final 5th wave up in a possible true blow-off. I have several targets on cash DJIA in the 22,000 area, but there is also a major confluence of price projections that line up around the 31,415 area. If we actually get to the pi target (3.1415) at some point, that would be a very high-confidence area to put on long-term short positions.
Kim Rice 3/22/15
Sunday, March 1, 2015
Major Inflection Point for Stocks in March 2015
With all the quantitative counterfeiting going on around the globe, cycles and other time projection methods haven't worked well for the last 5 years.... at least not for calling tops. None the less, my current long-term timing work is pointing to a major inflection point in Mar 2015, presumably a multi-month, significant top.
Geometric price projections on SPX are 2137, 2157, and 2180 for potential targets. For the DJIA, I have several projections to the low 18,000s, but also have other projections to 19,500 or higher. I think time is probably more important than price in the current analysis, primarily because the confluence of time projections lining up in March 2015 looks quite compelling. I think 3/13/15 (+/- a couple trading days) is a key area to watch for a possible top. However, the 3/31/15 area has some very interesting time symmetry with past market leg duration. I also have a few projections into April and June 2015 showing on the charts below. So, without putting too fine a point on it, I will just leave it as sometime in March 2015 the stock market should make an important top (+/- 1 month). If any of the price projections are being achieved near a date noted for a time projection, that would likely add to that set-up as being a possible top.
The cycle work posted back in November regarding the transports looks to be valid, as the transports peaked (so far) when projected by the cycle. They have not made new highs with the DJIA, which is setting up a potential DOW Theory sell if the divergence continues.
In addition to the analysis annotated on the charts posted below, I would note the following:
> 3/10/15 is Gann Master Number 5040cds from 5/21/01.
> 3/13/15 is .4pi (1256cds)from the 10/4/11 low.
> 3/31/15 is 10080cds [1440 weeks] from 8/25/87. This is the Gann Master Number 5040 x 2.
> Sentiment is reaching extremes of bullishness. For example, the percentage of bears reported by Investors Intelligence last week is similar to the low level that preceded the 1987 crash.
> There is also a confluence of major astro aspects occurring over the next several weeks per Ray Merriman's work.
> We will be entering another Puetz Crash Window following the upcoming solar and lunar eclipses on 3/20/15 and 4/4/15 respectively.
Good luck,
Kim Rice 3/1/15


Sunday, January 11, 2015
NYA Fractal and Dollar Price and Time Analysis
Below are 3 charts depicting a potential fractal/analog pattern unfolding in the NYA index. The fist chart is a longer term view to give context. The other 2 charts are zoomed in views to show the almost perfect symmetry between the 2007 top and the presumed 2014/2015 top. One never knows how long these types of analogs will track, but it's certainly one I'm watching and have it as my highest probability scenario until proven otherwise. Time-wise, it may need more time to play out before breaking down but it could break down at any time (if it is a big top that's formed over the last 6 months). If the NYA instead breaks out to new all-time highs, obviously the analog would not be tracking and some other pattern is underway.


Below is a long-term chart of the dollar with some price and time analysis I did a few weeks ago but never got around to posting. The bottom line on the dollar is I expect at least an intermediate top sometime in Jan 2015 followed by a multi-week or multi-month correction. After that anticipated correction the jury is still out, but I'm leaning toward a continuation of the bull move (ideally into early 2017).

The remaining charts below show some timing analysis I did a few weeks ago on the long-term DJIA chart. Based on the significant confluence of important time squares that line up in the late Dec 2014 to early Feb 2015 window, I think an important reversal is likely to occur. The next big CIT timing I see is in early March, but I'll have to post on that one later.


Kim Rice 1/11/15
Tuesday, November 25, 2014
Transports Most Overbought in History of the Index
Of course things can get even more overbought but the charts below show, per the monthly RSI indicator, the transports are currently the most overbought they have ever been. There are also some channel lines and long-term cycles lining up that may portend an important reversal soon. If the parabola continues much further, then I guess QE infinity will continue to rule the markets.
Kim Rice 11/25/14


Kim Rice 11/25/14


Sunday, November 23, 2014
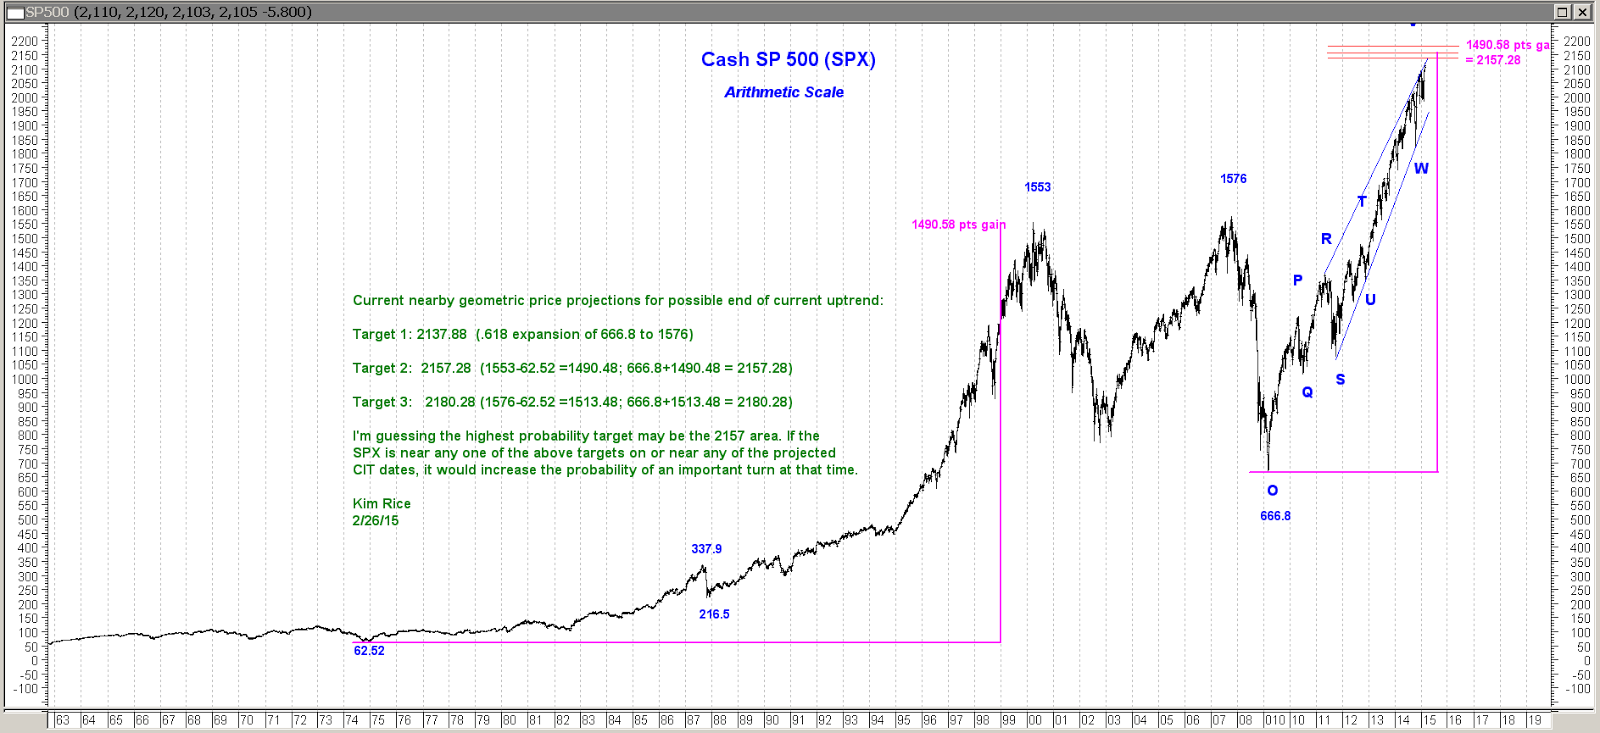
Potentially Important Geometry in DJIA and SPX
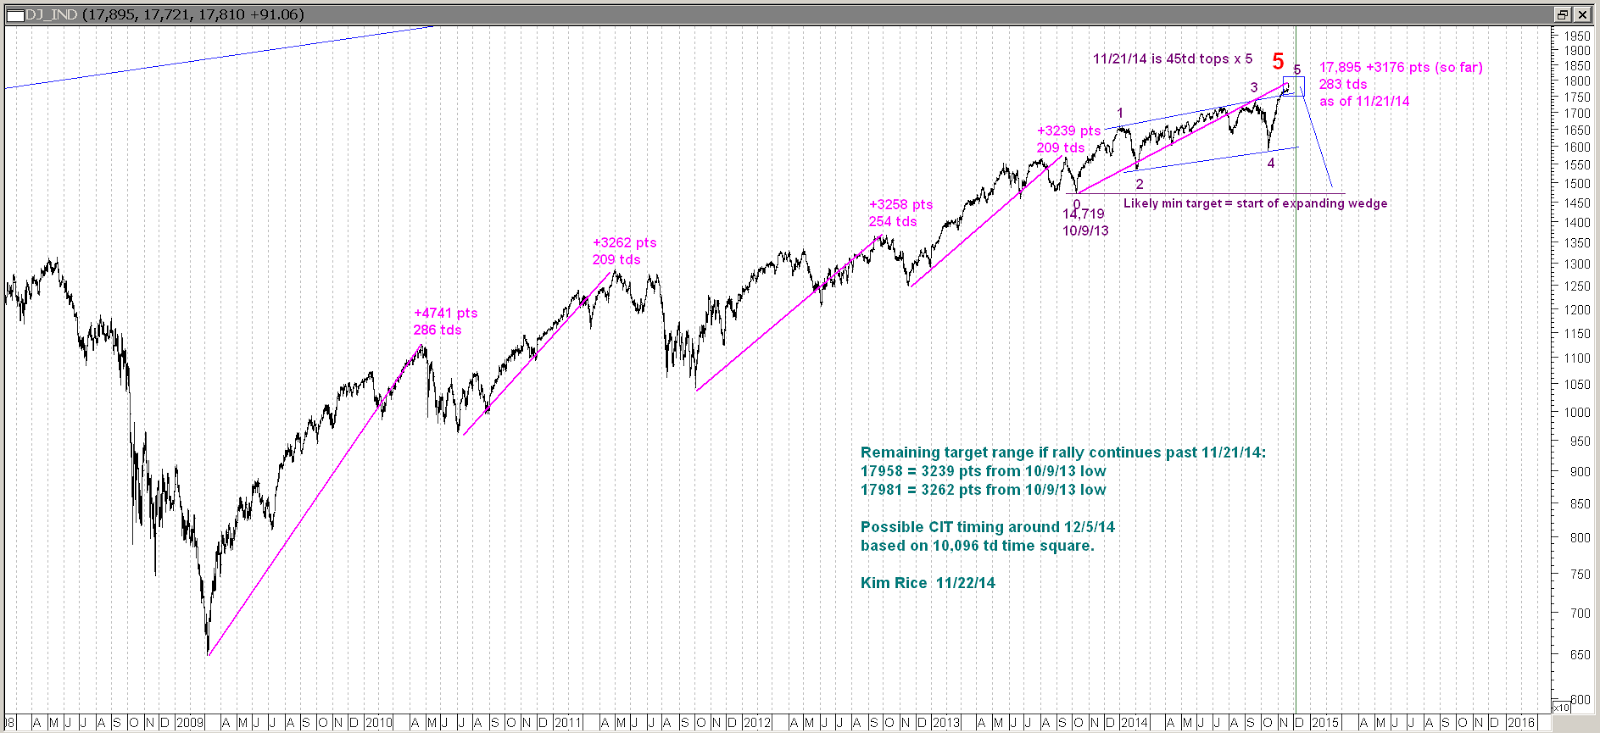
There are quite a few geometric relationships that line up in the 17,800 to 18,000 area on the DJIA. The last three rally phases have been similar in points gained in the Dow, ranging from 3,239 to 3,262 points each. The current rally leg has gone 3176 points so far which is in the ball park of the other rally legs. The time for each leg has been 209 to 286 trading days. The current leg is 283 tds so far.
There are a number of other short and long term timing elements that line up around 11/21/14, some of which are shown on the charts below. The next timing confluence is around 12/5/14, which may be part of the topping process if the market is topping. The next CIT timing I have appears to be around 12/31/14 to 1/5/15 area.
The charts below are annotated with price and time analysis I'm looking at that may portend a turn in the stock indices. I still think the earlier-posted analysis on the Value Line Arithmetic chart has the most important geometric confluence suggesting a significant top may be in the making. If the VLE, DJIA, and SPX all move above their respective projected resistance points (by more than 1% on a closing basis), I think that would likely invalidate the assumption of an intermediate (or major) top here. Keep in mind that technical analysis has really not worked well since the quantitative counterfeiting programs have under way for the last 5+ years and I have no way of knowing if that will change now. It will change at some point though, of that I'm quite sure.
Kim Rice 11/23/14


Wednesday, November 19, 2014
DJIA Price Projection: 17,886 Area
Since the DJIA cash has moved above the ideal target of 17,620, I thought I would look for the next confluence point. Applying a little bit of geometry, I find there is a confluence of multiple projections that line up around 17,886 (+/- 20 points or so).
For the moment the indices are playing out pretty much as anticipated in the 10/22/14 post - "Even if the DJIA, SPX and other indices go to new highs per scenario 2 above, I don't think the VLE will make new highs (another probe of the current highs maybe)." The Valueline Arithmetic index has probed the highs, but has not broken out (so far).
The sentiment is getting to extremes of bullishness by some measures. It seems unlikely a major bull move is unfolding with current sentiment and deteriorating technicals. It's much more likely to be a major blow-off top underway, with the next confluence point being around 17,886 basis cash DJIA.
Kim Rice 11/19/14
Subscribe to:
Posts (Atom)