Tuesday, November 25, 2014

Transports Most Overbought in History of the Index

Of course things can get even more overbought but the charts below show, per the monthly RSI indicator, the transports are currently the most overbought they have ever been. There are also some channel lines and long-term cycles lining up that may portend an important reversal soon. If the parabola continues much further, then I guess QE infinity will continue to rule the markets.

Kim Rice 11/25/14


Sunday, November 23, 2014

Potentially Important Geometry in DJIA and SPX

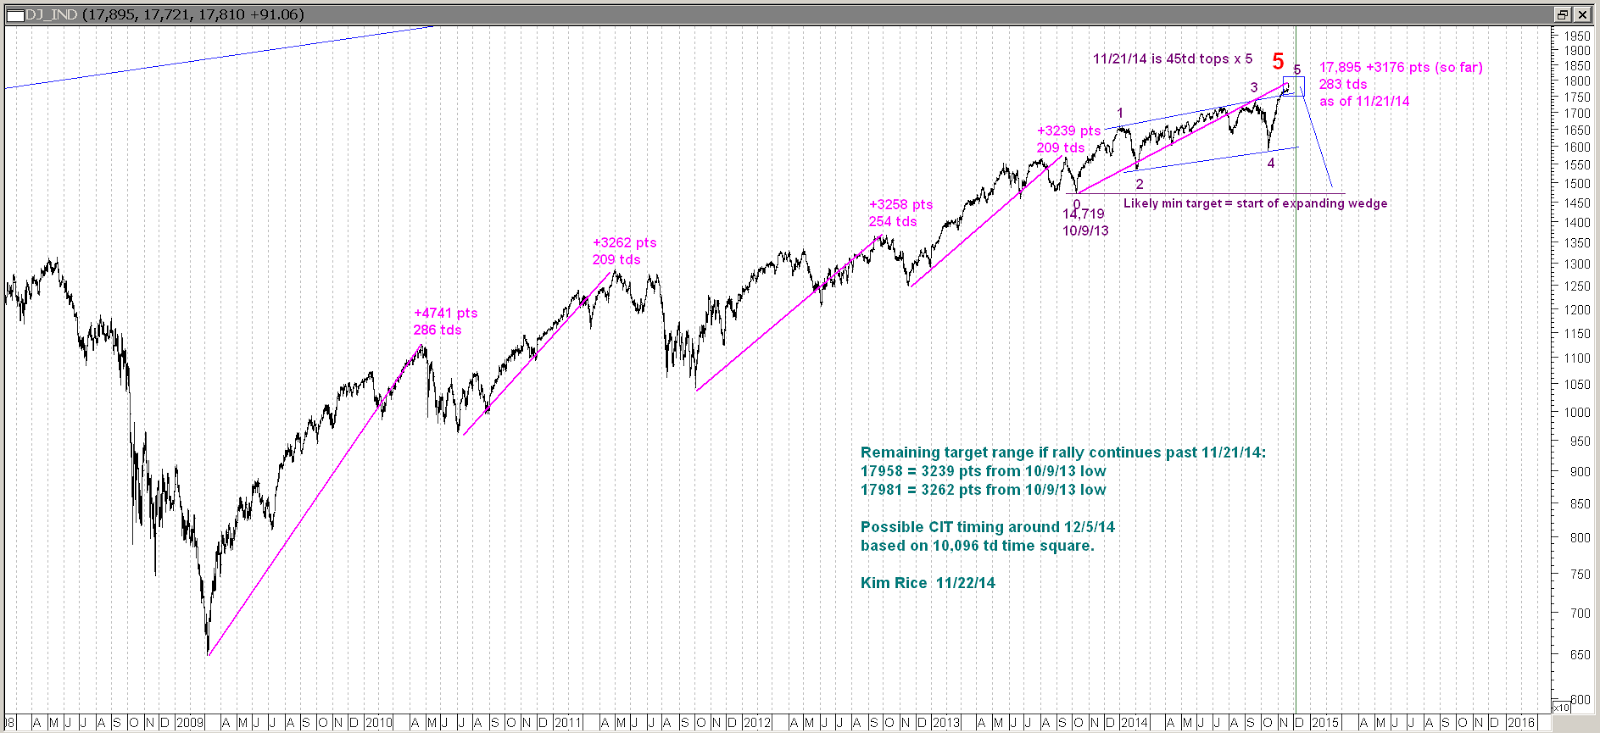
There are quite a few geometric relationships that line up in the 17,800 to 18,000 area on the DJIA. The last three rally phases have been similar in points gained in the Dow, ranging from 3,239 to 3,262 points each. The current rally leg has gone 3176 points so far which is in the ball park of the other rally legs. The time for each leg has been 209 to 286 trading days. The current leg is 283 tds so far.

There are a number of other short and long term timing elements that line up around 11/21/14, some of which are shown on the charts below. The next timing confluence is around 12/5/14, which may be part of the topping process if the market is topping. The next CIT timing I have appears to be around 12/31/14 to 1/5/15 area.

The charts below are annotated with price and time analysis I'm looking at that may portend a turn in the stock indices. I still think the earlier-posted analysis on the Value Line Arithmetic chart has the most important geometric confluence suggesting a significant top may be in the making. If the VLE, DJIA, and SPX all move above their respective projected resistance points (by more than 1% on a closing basis), I think that would likely invalidate the assumption of an intermediate (or major) top here. Keep in mind that technical analysis has really not worked well since the quantitative counterfeiting programs have under way for the last 5+ years and I have no way of knowing if that will change now. It will change at some point though, of that I'm quite sure.

Kim Rice 11/23/14

Wednesday, November 19, 2014

DJIA Price Projection: 17,886 Area

Since the DJIA cash has moved above the ideal target of 17,620, I thought I would look for the next confluence point. Applying a little bit of geometry, I find there is a confluence of multiple projections that line up around 17,886 (+/- 20 points or so).

For the moment the indices are playing out pretty much as anticipated in the 10/22/14 post - "Even if the DJIA, SPX and other indices go to new highs per scenario 2 above, I don't think the VLE will make new highs (another probe of the current highs maybe)." The Valueline Arithmetic index has probed the highs, but has not broken out (so far).

The sentiment is getting to extremes of bullishness by some measures. It seems unlikely a major bull move is unfolding with current sentiment and deteriorating technicals. It's much more likely to be a major blow-off top underway, with the next confluence point being around 17,886 basis cash DJIA.

Kim Rice 11/19/14

Sunday, November 2, 2014

Rare Expanding Diagonal in DJIA?


It appears that scenario #2 in the previous blog post is playing out, which is a rare expanding diagonal triangle. I think it's a fairly high probability this is the correct count from an E-wave and Edwards and McGee perspective. However, there are no absolutes when it comes to forecasting the markets. The invalidation point for this count would likely be a weekly close above 18,100. That would probably be too far for a normal 5th wave overthrow as the presumed pattern completes. Some timing and price projection targets are referenced on the charts posted below.

Kim Rice 11/2/14

Wednesday, October 22, 2014

Two Potential Scenarios for Stocks

The assumed ending diagonal I posted here, long before the ED pattern was mentioned before anyone else that I know of, took a while to play out. It may be the correct count but it still could morph into an expanding terminal fifth wave as shown in Scenario 2 below. Scenario 1 is based on potential time and price analogs with the past that could bring on some motivated selling if the market continues to track.

Kim Rice 10/22/14

Scenario 1 - Possible Crash Setup

The current DJIA pattern has a lot of similarity with previous tops before market crashes. Crashes don't happen often, so forecasting one has to be considered a low probability outcome. That being said, as noted on the following charts, price and time are tracking fairly close with a 9.9% decline in 18 trading days. If we follow that with a 62% to 78.6% retracement peaking around trading day 27 (+/- a day or two), the market would have satisfied step two in a potential crash sequence. The only step after that is an actual crash. If step 2 occurs, all one can do is place some bets and see what happens. Whether or not a crash will actually occur can not be known with any degree of certitude. Below are charts showing the 1929 and 1987 crash setups, which are followed by a chart of the current market with annotations regarding time and price symmetries. The charts were prepare on 10/19, prior to the latest ramp up in the markets.


Scenario 2 - Possible Expanding Terminal Wedge

The alternate count, which is think has about the same probability of occurring as scenario 1, is posted below. It shows that the ED pattern which has become somewhat more popular in the last few weeks may not be an ED at all. I think it looks like an ED and meets the requirements of an ED, but one can't rule out the potential to morph into an expanding wedge with one more new high to come. This count becomes primary if the DJIA and SPX exceed 78.6% retracements of the wave down from 9/19/14.


Lastly, I thought I'd post an update to the rather important analysis posted earlier on the Value Line index. The VLE exceeded the target a bit, but I found some additional geometric projections added to the update that very precisely add up to a monumental top in place. Even if the DJIA, SPX and other indices go to new highs per scenario 2 above, I don't think the VLE will make new highs (another probe of the current highs maybe).


Monday, June 30, 2014

Stock Market Chop Should End Soon

Based on some timing and pattern analysis I'm looking at in stocks, the sideways chop since the 6/24/14 outside day reversal should end 6/30 or 7/1 area and begin trending down thereafter. The next timing confluence I see is 7/15/14 +/- a trading day or two. My best guess regarding polarity is that it will likely be a low in that time-frame, but won't know until we get there.

Kim Rice 6/30/14

Thursday, June 26, 2014

Internals Weakening for Stocks & SPX Projection

For those that remain bullish on stocks, what is bullish about the following chart?


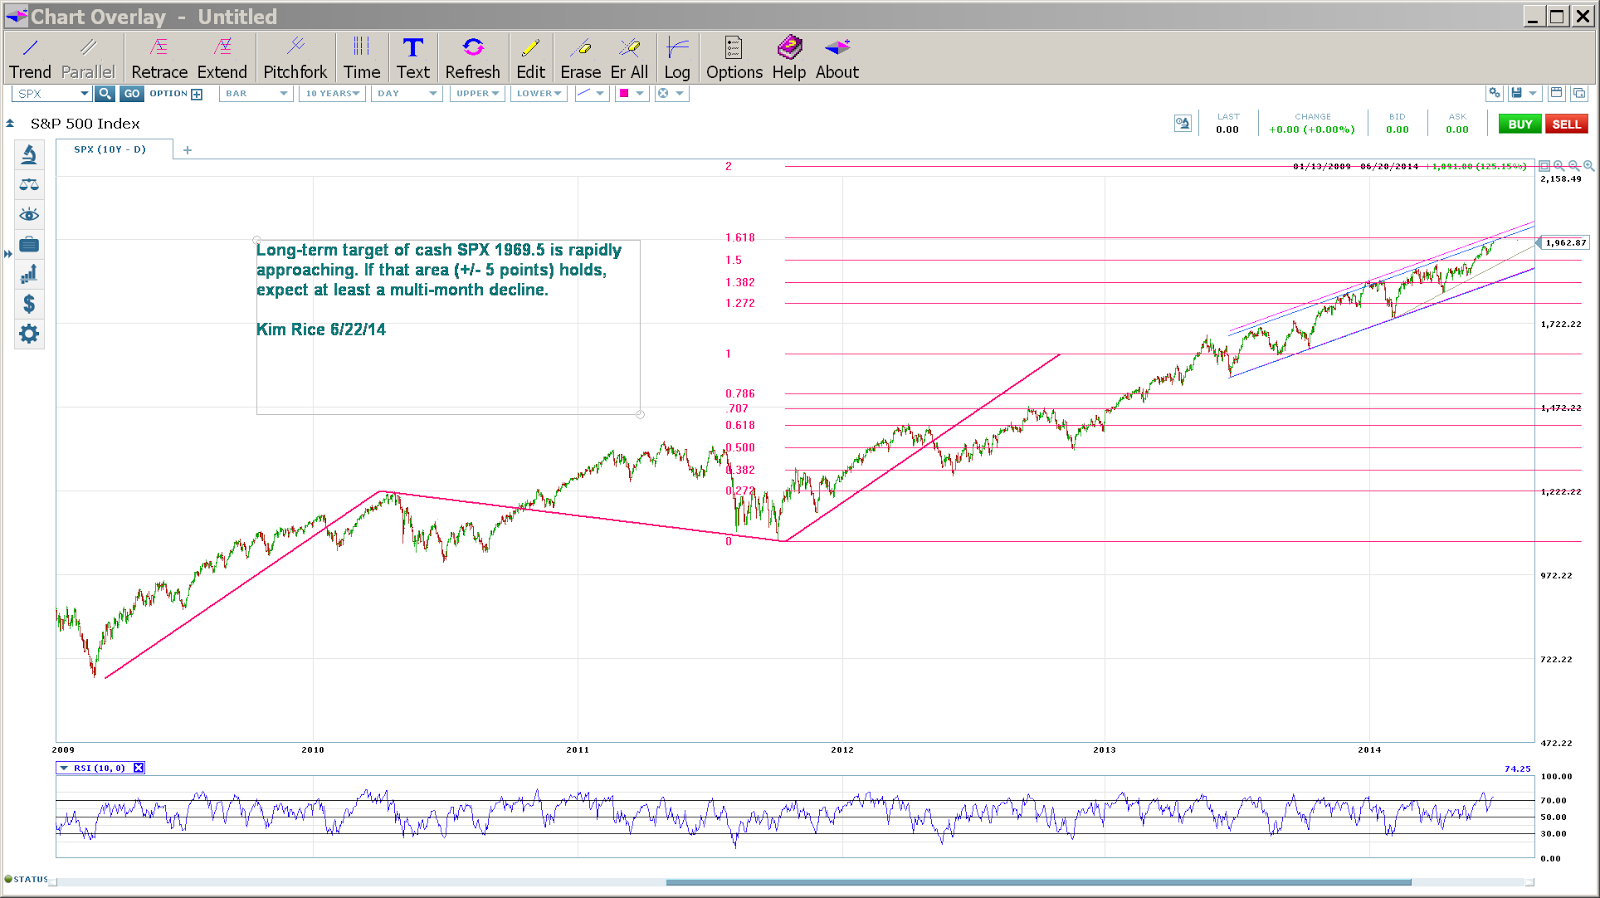
Here's a chart showing an interesting fibonacci projection I've been looking at for a potential top in stocks. We got within about 1 point of the exact target on 6/23/14.


Kim Rice 6/26/14