Monday, April 21, 2014
Next Swing High in Stocks Due 4/23/14
My analysis for this is based on some proprietary timing methods, so no charts today. After a bit more fine tuning, my timing work is pointing to 4/23/14 as the on-time day for the next swing high in stocks. If we do top around this time, my analysis suggests the on-time day for a potential low is 5/16/14 followed by a bounce and a lower low likely around 7/11/14. I would give the dates a trading day or two either way, but would be most alert for potential reversal on the on-time date. Price-wise, I think the swing down into mid May, if it occurs, should break below the 4/11/14 low and perhaps approach or even breach the 2/3/14 low. It's all theoretical speculation, as is every forecast about potential future events.
Kimston
Wednesday, February 19, 2014
More Timing Analysis for Stocks
Here is a chart with some analysis I did on 2/14/14 but never got around to posting. It has some additional timing projections/symmetries for potential important turn in late Feb to early March (presumably a top).

The 980td lows, shown on this chart from the previous blog post, still looms in late March....unless the cycle inverts.
Kim Rice 2/19/14
Sunday, February 9, 2014
Update on Stock Market Analysis and Timing for Feb/Mar 2014
I think the top is probably in on the DJIA, though a significant move above the 12/31/13 highs would flush that idea. The high on 12/31/13 was exactly at an expression of pi in time: 31.4159 years from the 8/9/82 low, as noted on this chart posted 12/29/13. That translates to 11,467 cal days calculated as 31.4159 x 365. If you add 11,467 cal days (or 31.4159 years) to 8/9/82 it equals 12/31/13. Also, the DJIA appears to have 5 waves down from the top, whereas most other indicies are difficult to count as 5s down. So, it's very possible that some indicies run to new highs into Feb/Mar timeframe while the DJIA does not (or perhaps the DJIA double tops).
The price projections to the 4400 area for the valueline index shown on the charts in the previous post were pretty much hit exactly at the highs a few weeks back. Still can't rule out a run to the 4438 area (or higher) if the topping process isn't done. Here's an update of the VLE chart showing an intraday high so far of 4414.

Here are updates to several charts posted recently. The DJIA stopped right at the upper trend line. The Russell 2000 had a bit of a throw-over on wave 5, about the same as the throw-under at wave 4.


The following chart is annotated with analysis showing potential timing of turns in Feb and Mar 2014. Cycles and time squares work for a while and then just stop without notice. I have no idea if the cycles and timing projections noted on this next chart will work or not, but they do present areas to look for trades/reversals.

Lastly, here is a chart showing the top of the Tulip Bulb Mania back in the 1600s. As I've noted in the past, Feb 2014 marks the 377 (fibonacci) year anniversary of that top which was followed by a total collapse. I suppose our current stock market could rhyme with that period, given the fact that the whole market is one giant bubble largely supported by central banks around the world. However, even if we are making a major top, I suspect the move down wouldn't be anywhere near as dramatic.

Kim Rice 2/9/14
Sunday, December 29, 2013
1/10/14 and Another Look at Time and Price Projections for Stocks
[1/6/13 edit: I noticed there are two typos in annotations on the first Valueline chart. It should say "4392 is where DE=FG" and "4361 is where DG = 2*BC"]
Well, the markets wasted no time in ignoring the confluence of price projections on DJIA noted in the last post.
With some sentiment readings like Investors Intelligence with bull/bear spreads at all-time highs, I don't think breaking above price projection points is a reason to turn bullish at this point. Rather, I think one has to look for the next compelling price and time projections that may mark a turn.
I did some analysis on the Valueline Arithmetic index and found some very compelling price symmetry and Fib expansions in log and arithmetic scale that point to an area not far above the close of 4357.63 on 12/27/13. The range of projections is from 4360 to 4560 with the majority pointing to 4440 area. If we trade up into this range on or near 1/10/14, I would think the odds of some sort of top forming increase significantly.
As annotated on the S&P chart posted below, I sniffed out what appears to be important timing which would ideally hit on 1/10/14 (+ or - a couple tds). However, based on timing noted in the previous blog post, I think a top could reasonably be expected anytime in the first few weeks of Jan 2014.
Even if we do get a top in this early Jan area, based on other analysis not shown, I still expect a retest of the top (higher, lower or double top) around 3/27/14 area.
Lastly, I think the pattern in the RUT looks particularly compelling as an expanding rising wedge. If so, it should be completely retraced when the market finally does roll over. It doesn't always happen, but these patterns frequently have a throw-over of the upper trendline when completing. The vertical blue lines are a potential target range (if a throw-over occurs) based on some price projections from prior swings in RUT.
Kim Rice 12/29/13


Sunday, December 22, 2013
Stocks: Deconstructing the Geometry and Cycles
The Dow has moved slightly above the 16180 - 16200 range noted in previous post as an expression of the Fibonacci ratio, which would have been a fascinating place for a top. Rightly or wrongly, I'm still looking for an important top in stocks and we should be pretty much there now as shown on the charts below. Based on the analysis on the charts, I think it would take a weekly close over 16,400 to invalidate the current fib expansions/projections. You always have to allow a little slippage on projections, but anything much above 16,400 would be pushing it beyond a "little slippage" I think.
The long and medium term trendlines on DJIA and NQ are still holding, with last week's advance touching them again. Strong weekly closes over the trendlines would become troubling for the argument for a top here.
The cycles I was looking at for a low at the end of the year may be inverting. Guessing polarity in advance is always tricky and, of course, cycles typically will just stop working after a number of iterations. If the market does turn down in the next few days/weeks I have some indications for a CIT/Low around 1/30/14 area. My long-term cycle analysis is still projecting a new high, double-top or lower high in March 2014 (ideally around 3/26 or 3/27), after which pretty much all cycles are pointing down (if cycles work any more in the era of QE).
Of course sentiment remains at extremes, and now there are all sorts of technical divergences cropping up in things like RSIs, breadth and new high indicators, etc.
Kim Rice 12/21/13


Thursday, December 19, 2013
DOW Closes at 16179.08, a Near Perfect Expression of Fibonacci
As posted here recently, a superb target for a potential major top on the DJIA would be 16,180 to 16,200. Today's high was 16,194 and the close was one point off of a perfect 16,180. Of course this is a highly speculative observation, which hasn't been mentioned by anyone else that I'm aware of. We'll find out soon enough if the markets react to it.
Kim Rice 12/19/13
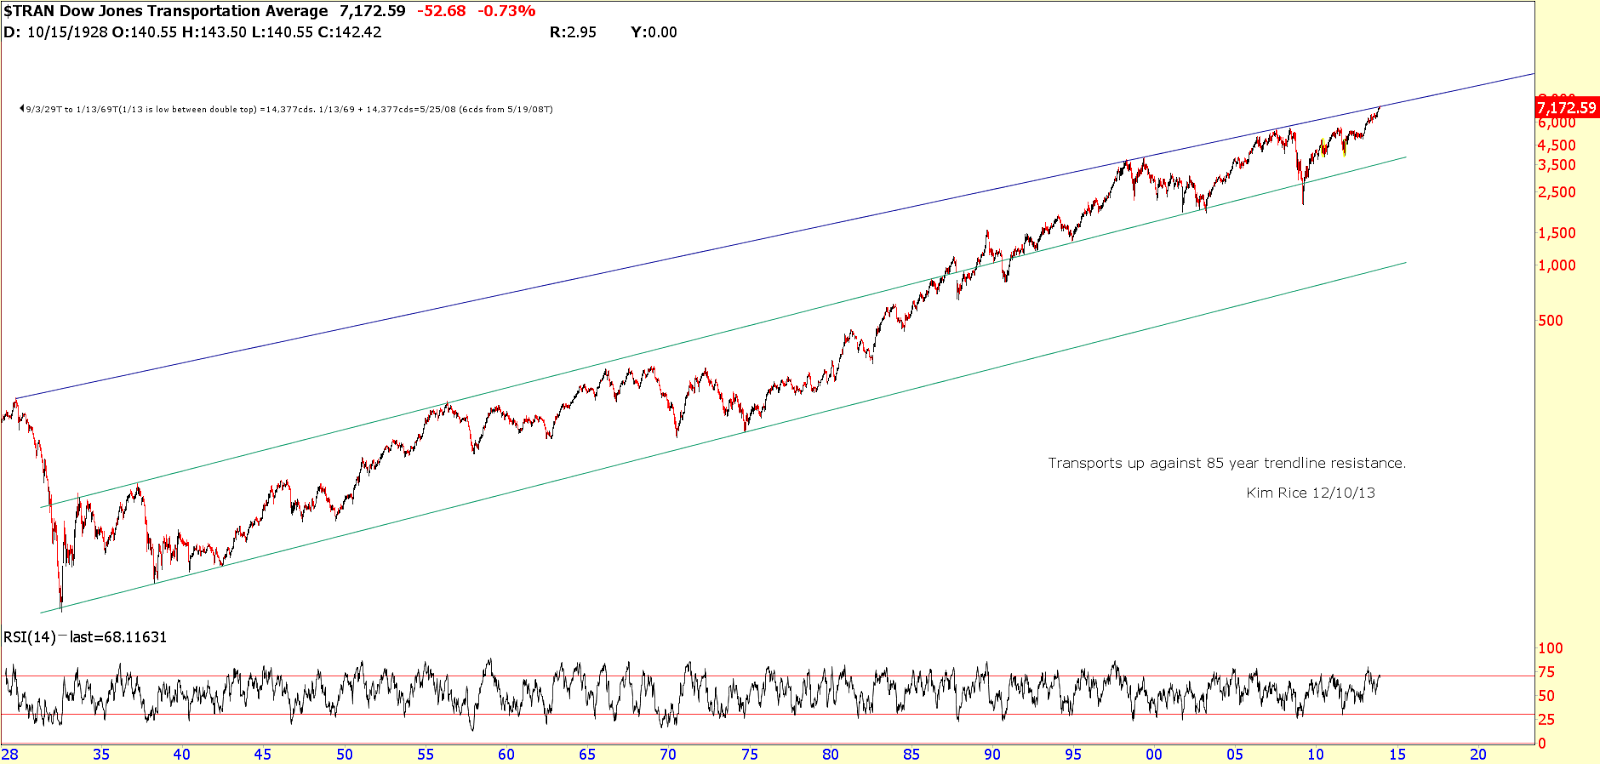
Tuesday, December 10, 2013
Trendline Resistance for Stock Indicies
Some major indexes are up against long term trendline resistance while sentiment is pretty much as bullish as it gets. Both of these are occurring as some major timing symmetries are coming together this week (as shown on previous posts). Seems like as good a time as any for a rug pull. We'll see soon if enough if that happens or if the fed can power the markets through all the technical headwinds.
Kim Rice 12/10/13


Subscribe to:
Posts (Atom)