Sunday, March 20, 2016

Metals and Miners Update


As annotated on the charts posted below, GDX is nearing potentially important resistance in the 23 area. Although in my last post they managed to fake me out of most of the miners, it turned out be a capitulation move. When there was no follow-through to the downside, I bought back into a relatively small position in NUGT which has now more than tripled. Fortunately, I also held on to a position in HMY which has gone up about seven fold. I'll be looking to close out mining shares and potentially go short GDX at 23 with a tight stop. I'm raising stops on NUGT and HMY now in case the rally in miners fails and GDX doesn't reach 23.

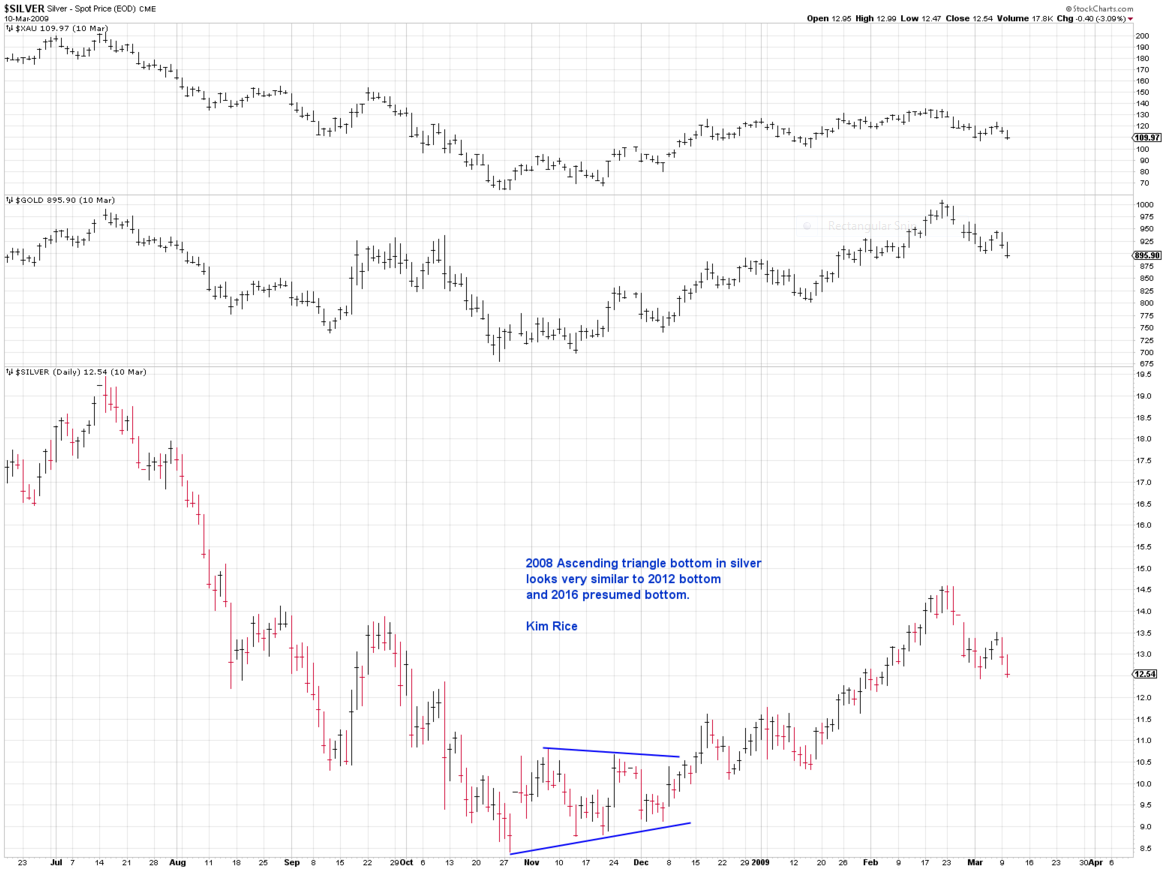
The move up in silver mining shares (along with the gold miners), while silver goes essentially sideways, typically portends a catch-up phase for silver to come. I don't know if it will happen this time, but I think there is better than a 50% chance of a violent vertical move up before we peak and potentially trend lower into the forth quarter of 2016. The ideal timing for a top in silver and gold is sometime from mid to late April 2016, assuming the rally has not ended as of last week. I'm still holding long futures in the metals as well as long-term call options on SLV. However, I"m watching closely for signs of a failure here at the trendline resistance shown below, and have stops entered on the futures longs. It's not really practical to use stops on options, so those are a little tougher to protect profits.


Kim Rice 3/20/16


Tuesday, January 19, 2016

Carnage in the Miners

Silver is still holding the 14 yr trendline for the moment and gold is still acting well, so I'm still holding positions in futures. However, with the breakdown in miners under the lows from last month, I'm getting much lower projections. For example, I think XAU has a reasonable chance of running down to 23.30 area at some point. So I dumped all the miners and mining share ETF positions. Stop on silver remains at weekly close under 13. If the pattern and trendline continue to hold together for silver, I don't really think it moves up much until crude bottoms. In my work, that isn't scheduled to occur until about the end of the month give or take a few trading days.

Kim Rice 1/19/16

Sunday, January 10, 2016

Silver's Ascending Triangle Bottom, and Mining Share Analysis

As shown on the charts below, the current pattern in silver looks link an ascending triangle and is very similar to the major low in 2008 and the intermediate swing low in 2012. If this analog continues to track those earlier basing patterns, it may portend another week or two of chop within the pattern before heading sharply higher over the next several months.

Also posted are several charts of miners that I didn't get around to posting last week. The analysis on these is quite compelling for an important intermediate low in the making. This is just a small sampling of the many mining shares that have incredible long-term setups in place for low-risk entry on the long side.


My stop on all positions in futures, mining shares, NUGT, GDX, GDXJ, USLV, UGLD and long-term SLV calls remains a weekly close under 13 on silver. If that were to happen, I think it would likely indicate a pattern failure for the ending diagonals in gold and silver and a failure of the near-term, presumed ascending triangle in silver.

Kim Rice 1/10/16

Sunday, January 3, 2016

Metals Update 1/3/16

While there is a lot of geometric, Ewave and other technical analysis pointing to a potential intermediate low in the making for metals and miners, there is no certitude with anything in the markets. If the patterns and projects begin breaking down and failing, I will be running for cover. As noted several times, there are still nearby but lower projections that have not been hit. Posted below are a few charts annotated with analysis that shows where support may come in if the recent lows get taken out. Specifically, there is a pretty significant confluence for silver in the 13.10 to 13.40 area and for gold in the 1010 to 1018 area.

Also shown on one of the charts is some timing analysis with projections for possible lows around 1/5/16 +/- 2 trading days, assuming cycles are working in the markets. Hopefully the federal reserve and central bank game of whack a mole with gold and silver is coming to an end soon. Price is holding up inside the patterns and long-term trendline in silver, so far, and cycles should bottom and turn up in the next few trading days. If not heading north by mid Jan, I would assume cycles aren't engaged.

The long-term trendlines are still holding on some of the miners mentioned several weeks back. When I get some time I'll post some charts with that analysis.

Kim Rice 1/3/16

Sunday, December 20, 2015

More on Precious Metals Potential Setup


"IF" my analysis is correct that silver and gold are completing ending diagonal patterns into key price support, then the metals should have the biggest rally since the 2011 top. My stop on the entire position in miners, gold and silver remains at a weekly close under 13 on silver.

If these are EDs, when the metals reverse to the upside the rally should be a rocket ride to the minimum projection areas of 21-22 on silver and 1340ish on gold. I think targets at 26 and 1400 or higher will probably play out eventually, but I'm already getting ahead of myself until there is a definitive breakout to the upside.

One of the problems with EDs is they can take their time with the actual launch. Sometimes they reverse immediately after the 5th wave is done and sometimes they have a few false starts and retest a time or two before the real move starts. So, the metals could lift off at any time or they could chop around for several months first. We will find out in the fullness of time.

Posted below are a few more charts with additional analysis suggesting an intermediate low may be in the making. This is all just theoretical based on empirical evidence, though I think this setup is a pretty high-probability one given the massive confluence lining up in price projections and trend line support. As noted several several times now, a weekly close under 13 in silver would likely invalidate the analysis.

Kim Rice 12/20/15

Sunday, December 13, 2015

Precious Metals Update (Silver Analysis)


Silver has dipped down to my long-held forecast range of 13.25 to 13.75. The rising trendline from the 2003 and 2008 lows is currently at 13.68 as can be seen on the first two charts below. The low on 12/11/15 was 13.75, so we are essentially there.

Silver's 50% retracement in log scale, as seen on the third chart, comes in at 13.35 area and is still a very viable target that may get hit. This would require a bit of a break of the long-term trendline, but only by about 40 cents or so. Note that the .236 and .382 retracement levels pretty much nailed previous intermediate lows, which adds the potential of the .5 level getting hit.

On the forth chart the 100% expansion of the first wave down in 2011 projects to 13.70 area, so it lines up as a confluence in price with the trendline support at 13.68. So we have two potentially important targets, one of which has come within 5 to 7 cents of getting hit and the other is only 35 cents below that.

The miners and gold are diverging with silver and not making new lows on this latest dip in silver (at least not yet). I view this as a positive development which may support the concept of an intermediate low forming in the precious metals complex. I think a weekly close under 13 in silver would call this all into question and will be my stop on the position I have been accumulating in mining shares, gold and silver. There is also some major cycle timing due around Feb 2017, so there may be retest of lows or deep retracement into that time-frame, assuming we do get a rally in metals here. Pattern-wise it looks like silver and gold are finishing up 5th wave falling wedges. If so, the minimum target for a rally should be back to where the wedges started: 21 to 22 area for silver and 1340 for gold.

Regarding the stock market, I'm still waiting for SPX projections just above 2200 to get hit before looking for high confidence shorting opportunity. I remain flat.

Kim Rice
12/13/15


Monday, August 10, 2015

SPX: Cluster of 5 Projections 2214 to 2220


Price:
There are five major geometric projections clustered from 2214 to 2220 area. I think there is a fairly high probability that this price cluster will be hit before an intermediate or larger correction occurs. So I am changing my highest probability target to this cluster area, with 2157 now being the minimum target.

Time:
Ideal timing for a possible top remains around 8/28/15, but it could be as early as 8/19 and as late as 9/10/15. I think in this case, price will be more important than time. If 2214 to 2220 gets hit, I would think time has probably run out and would be on maximum alert for reversal signals.

Kim Rice 8/10/15